Advanced Search
Volume 43 Issue 1
Feb.  2025
Turn off MathJax
Article Contents

GAO Yuan, REN ChuanZhen, FANG Qiang, WU HuaiChun, SHI MeiNan, ZHANG ShiHong, YANG TianShui, LI HaiYan. Cyclostratigraphy of the Ordovician Saergan Formation in the Tarim Basin[J]. Acta Sedimentologica Sinica, 2025, 43(1): 88-98. doi: 10.14027/j.issn.1000-0550.2022.165
Citation: GAO Yuan, REN ChuanZhen, FANG Qiang, WU HuaiChun, SHI MeiNan, ZHANG ShiHong, YANG TianShui, LI HaiYan. Cyclostratigraphy of the Ordovician Saergan Formation in the Tarim Basin[J]. Acta Sedimentologica Sinica, 2025, 43(1): 88-98. doi: 10.14027/j.issn.1000-0550.2022.165

Cyclostratigraphy of the Ordovician Saergan Formation in the Tarim Basin

doi: 10.14027/j.issn.1000-0550.2022.165
Funds:

National Natural Science Foundation of China 41925010

National Natural Science Foundation of China 42072039

  • Received Date: 2022-11-04
  • Accepted Date: 2023-02-16
  • Rev Recd Date: 2022-12-30
  • Available Online: 2023-02-16
  • Publish Date: 2025-02-10
  • Objective The Middle-Upper Ordovician Saergan Formation in the Tarim Basin represents an important hydrocarbon source rock deposited in a marine environment. However, the current model of the deposition of the Saergan Formation remains nebulous. High-precision geochronologic constraints may shed new light on the deposition history of the Saergan Formation. Methods The identification of Milankovitch cycles, in particular, a 405 ka long orbital eccentricity cycle, can be used to construct precise time scales for the sedimentary succession of the Paleozoic Era. The magnetic susceptibility (MS) is a measure of the degree of magnetization of a material in response to an applied magnetic field, which can be a powerful tool for cyclostratigraphy and paleoclimate studies. Here, a total of 701 MS measurements from the 9 m Saergan Formation in the Subashigou section of the Kalpin area, Aksu city, Xinjiang were obtained to conduct a cyclostratigraphic analysis, including a multitaper method spectral analysis, an evolutive harmonic analysis, and bandpass filtering. Results The spectral analyses show significant peaks at 0.74-1.28 m, 0.2-0.27 m, 0.057-0.071 m, and 0.035-0.039 m with ratios of 21.14∶1, 7.71∶1, 5.71∶1, 1.86∶1, and 1.11∶1, which are close to those of the Middle-Late Ordovician astronomical cycles. Although there is no reliable astronomical solution for the Ordovician period, astronomical calibration can be achieved using a stable 405 ka eccentricity cycle. After the 405 ka long eccentricity calibration, the spectral analysis shows periods with 100 ka (short eccentricity), 30.6-31.2 ka (obliquity), and 20-21.8 ka (precession). Ten eccentricity cycles are obtained using bandpass filtering and a “floating” astronomical time scale with a duration of ~3.9 Ma is established for the Saergan Formation of the Subashigou section. An amplitude modulation (AM) envelope of the interpreted 30.6 ka band of the 405 ka calibrated MS time series reveals long-term cycles with a period of ~1.2 Ma for the Ordovician, which is identical with that at present. The first appearance datum (FAD) of the graptolite Nemagraptus. gracilis is used as a tie point for building the correlation between the Subashigou section and Dawangou section (Global Stratotype Section and Point auxiliary Stratotype of the Sandbian). The results show that the initiation of deposition of the Saergan Formation in the Subashigou section was ~1.03 Ma later than that in the Dawangou section. This supports the assertion that the Saergan black shales developed during a strong sea-level transgression process, which drowned the platform, and organic-rich sediments were deposited on the carbonate platform. Based on a further comparison among the MS series, 1.2 Ma obliquity cycle, and global sea-level curve during the Middle-Late Ordovician, we suggest that the 1.2 Ma long obli-quity cycle may have controlled the sea-level changes during the time of the Saergan Formation deposition. Ice accumulation at the million year scale can be explained by a sustained reduction of ice melting in cool high-latitude summers during an interval of a series of reduced obliquity variations (minima of the long term obliquity cycle). Conclusions In summary, the orbitally forced formation of the Saergan Formation is confirmed and a possible model of the deposition process of the Saergan shale is proposed based on the high-resolution cyclostratigraphy study in this study.
  • [1] 马璐,张智礼,王冠,等. 塔里木柯坪地层区中—上奥陶统萨尔干组碳酸盐岩微相和古地理[J]. 微体古生物学报,2013,30(4):344-352.

    Ma Lu, Zhang Zhili, Wang Guan, et al. Microfacies of the carbonates and palaeogeography of the Saergan Formation (Middle-Upper Ordovician), Kalpin stratigraphic region, Tarim, NW China[J]. Acta Micropalaeontologica Sinica, 2013, 30(4): 344-352.
    [2] 姚尧,何治亮,李慧莉,等. 塔里木盆地阿瓦提断陷中—上奥陶统萨尔干组沉积地质模型与烃源岩分布预测[J]. 石油与天然气地质,2020,41(4):763-775.

    Yao Yao, He Zhiliang, Li Huili, et al. Sedimentary geological model and distribution prediction of source rocks in the Saergan Formation (Middle-Upper Ordovician) in Awati fault depression, Tarim Basin[J]. Oil & Gas Geology, 2020, 41(4): 763-775.
    [3] 张水昌,张宝民,王飞宇,等. 中—上奥陶统:塔里木盆地的主要油源层[J]. 海相油气地质,2000,5(1/2):16-22.

    Zhang Shuichang, Zhang Baomin, Wang Feiyu, et al. Middle-Upper Ordovician: Main source rock of the Tarim Basin[J]. Marine Origin Petroleum Geology, 2000, 5(1/2): 16-22.
    [4] 王大锐,宋力生. 论我国海相中上奥陶统烃源岩的形成条件:以塔里木盆地为例[J]. 石油学报,2002,23(1):31-34,39.

    Wang Darui, Song Lisheng. A thesis about forming conditions of marine Middle-Upper Ordovian source rocks in China[J]. Acta Petrolei Sinica, 2002, 23(1): 31-34, 39.
    [5] 赵宗举,周新源,郑兴平,等. 塔里木盆地主力烃源岩的诸多证据[J]. 石油学报,2005,26(3):10-15.

    Zhao Zongju, Zhou Xinyuan, Zheng Xingping, et al. Evidences of chief source rock in Tarim Basin[J]. Acta Petrolei Sinica, 2005, 26(3): 10-15.
    [6] 王飞宇,杜治利,张宝民,等. 柯坪剖面中上奥陶统萨尔干组黑色页岩地球化学特征[J]. 新疆石油地质,2008,29(6):687-689.

    Wang Feiyu, Du Zhili, Zhang Baomin, et al. Geochemistry of Salgan black shales of Middle-Upper Ordovician in Keping outcrop, Tarim Basin[J]. Xinjiang Petroleum Geology, 2008, 29(6): 687-689.
    [7] 高志前,樊太亮,李岩,等. 塔里木盆地寒武系—奥陶系烃源岩发育模式及分布规律[J]. 现代地质,2006,20(1):69-76.

    Gao Zhiqian, Fan Tailiang, Li Yan, et al. Development pattern and distribution rule of source rock of Cambrian-Ordovician in Tarim Basin[J]. Geoscience, 2006, 20(1): 69-76.
    [8] 高志勇,张水昌,李建军,等. 塔里木盆地西部中上奥陶统萨尔干页岩与印干页岩的空间展布与沉积环境[J]. 古地理学报,2010,12(5):599-608.

    Gao Zhiyong, Zhang Shuichang, Li Jianjun, et al. Distribution and sedimentary environments of Salgan and Yingan shales of the Middle-Upper Ordovician in western Tarim Basin[J]. Journal of Palaeogeography, 2010, 12(5): 599-608.
    [9] 高志勇,张水昌,刘烨,等. 新疆柯坪大湾沟剖面中—上奥陶统烃源岩高频海平面变化与有机质的关系[J]. 石油学报,2012,33(2):232-240.

    Gao Zhiyong, Zhang Shuichang, Liu Ye, et al. Relationship between high-frequency sea-level changes and organic matter of Middle-Upper Ordovician marine source rocks from the Dawangou section in the Keping area, Xinjiang[J]. Acta Petrolei Sinica, 2012, 33(2): 232-240.
    [10] 林畅松,杨海军,蔡振中,等. 塔里木盆地奥陶纪碳酸盐岩台地的层序结构演化及其对盆地过程的响应[J]. 沉积学报,2013,31(5):907-919.

    Lin Changsong, Yang Haijun, Cai Zhenzhong, et al. Evolution of depositional architecture of the Ordovician carbonate platform in the Tarim Basin and its response to basin processes[J]. Acta Sedimentologica Sinica, 2013, 31(5): 907-919.
    [11] 赵宗举. 全球海平面变化指标及海相构造层序研究方法:以塔里木盆地奥陶系为例[J]. 石油学报,2015,36(3):262-273.

    Zhao Zongju. Indicators of global sea-level change and research methods of marine tectonic sequences: Take Ordovician of Tarim Basin as an example[J]. Acta Petrolei Sinica, 2015, 36(3): 262-273.
    [12] Zhang Y D, Munnecke A. Ordovician stable carbon isotope stratigraphy in the Tarim Basin, NW China[J]. Palaeogeography, Palaeoclimatology, Palaeoecology, 2016, 458: 154-175.
    [13] Zhang Y D, Chen Xu, Yu G H, et al. Ordovician and Silurian rocks of northwest Zhejiang and northeast Jiangxi provinces, SE China[M]. Hefei: University of Science and Technology of China Press, 2007.
    [14] Bergström S M, Finney S C, Chen X, et al. A proposed global boundary stratotype for the base of the Upper series of the Ordovician System: The Fågelsång section, Scania, southern Sweden[J]. Episodes, 2000, 23(2): 102-109.
    [15] 贾承造. 塔里木盆地及周边地层[M]. 北京:科学出版社,2004.

    Jia Chengzao. Stratigraphy of the Tarim Basin and adjacent areas[M]. Beijing: Science Press, 2004.
    [16] Chen X, Zhang Y D, Wang Z H, et al. Biostratigraphy[M]//Chen X, Bergström S M, Finney S C, et al. Darriwilian to Katian (Ordovician) graptolites from northwest China. Elsevier, 2017: 7-38.
    [17] 吴怀春,张世红,冯庆来,等. 旋回地层学理论基础、研究进展和展望[J]. 地球科学:中国地质大学学报,2011,36(3):409-428.

    Wu Huaichun, Zhang Shihong, Feng Qinglai, et al. Theoretical basis, research advancement and prospects of cyclostratigraphy[J]. Earth Science: Journal of China University of Geosciences, 2011, 36(3): 409-428.
    [18] Fang Q, Wu H C, Wang X L, et al. An astronomically forced cooling event during the Middle Ordovician[J]. Global and Planetary Change, 2019, 173: 96-108.
    [19] Zhong Y Y, Wu H C, Fan J X, et al. Late Ordovician obliquity-forced glacio-eustasy recorded in the Yangtze Block, South China[J]. Palaeogeography, Palaeoclimatology, Palaeoecology, 2020, 540: 109520.
    [20] 任传真. 华南宜昌地区中—晚奥陶世地层旋回地层学研究[D]. 北京:中国地质大学(北京),2020.

    Ren Chuanzhen. Cyclostratigraphy study of the Middle-Late Ordovician in Yichang, South China[D]. Beijing: China University of Geosciences (Beijing), 2020.
    [21] 陈旭,张元动,李越,等. 塔里木盆地及周缘奥陶系黑色岩系的生物地层学对比[J]. 中国科学:地球科学,2012,42(8):1173-1181.

    Chen Xu, Zhang Yuandong, Li Yue, et al. Biostratigraphic correlation of the Ordovician black shales in Tarim Basin and its peripheral regions[J]. Science China: Earth Sciences, 2012, 42(8): 1173-1181.
    [22] Klootwijk C. Middle-Late Paleozoic Australia-Asia convergence and tectonic extrusion of Australia[J]. Gondwana Research, 2013, 24(1): 5-54.
    [23] Cocks L R M, Torsvik T H. The dynamic evolution of the Palaeozoic geography of eastern Asia[J]. Earth-Science Reviews, 2013, 117: 40-79.
    [24] Huang B C, Yan Y G, Piper J D A, et al. Paleomagnetic constraints on the paleogeography of the East Asian blocks during Late Paleozoic and Early Mesozoic times[J]. Earth-Science Reviews, 2018, 186: 8-36.
    [25] 贾承造. 中国塔里木盆地构造特征与油气[M]. 北京:石油工业出版社,1997.

    Jia Chengzao. Tectonic characteristics and petroleum, Tarim Basin, China[M]. Beijing: Petroleum Industry Press, 1997.
    [26] 何文渊,李江海,钱祥麟,等. 塔里木盆地柯坪断隆断裂构造分析[J]. 中国地质,2002,29(1):37-43.

    He Wenyuan, Li Jianghai, Qian Xianglin, et al. Analysis of fault structures in the Kalpin fault uplift, Tarim Basin[J]. Geology in China, 2002, 29(1): 37-43.
    [27] Kodama K P, Hinnov L A. Rock magnetic cyclostratigraphy[M]. Chichester: John Wiley & Sons, 2015: 1-160.
    [28] Zhang S H, Wang X L, Zhu H. Magnetic susceptibility variations of carbonates controlled by sea-level changes[J]. Science in China Series D: Earth Sciences, 2000, 43(3): 266-276.
    [29] Racki G, Racka M, Matyja H, et al. The Frasnian/Famennian boundary interval in the South Polish-Moravian shelf basins: Integrated event-stratigraphical approach[J]. Palaeogeography, Palaeoclimatology, Palaeoecology, 2002, 181(1/2/3): 251-297.
    [30] Lean C M B, McCave I N. Glacial to interglacial mineral magnetic and palaeoceanographic changes at Chatham Rise, SW Pacific Ocean[J]. Earth and Planetary Science Letters, 1998, 163(1/2/3/4): 247-260.
    [31] Sun Y B, Clemens S C, An Z S, et al. Astronomical timescale and palaeoclimatic implication of stacked 3.6-Myr monsoon records from the Chinese Loess Plateau[J]. Quaternary Science Reviews, 2006, 25(1/2): 33-48.
    [32] Weedon G P. Time-series analysis and cyclostratigraphy: Examining stratigraphic records of environmental cycles[M]. Cambridge: Cambridge University Press, 2003.
    [33] Thomson D J. Spectrum estimation and harmonic analysis[J]. Proceedings of the IEEE, 1982, 70(9): 1055-1096.
    [34] Core Team R. R: A language and environment for statistical computing[M]. Vienna: R Foundation for Statistical Computing, 2014.
    [35] Meyers S R. Astrochron: An R package for astrochronology[M/OL]. [2014]. http://cran.r-project.org/package=astrochron.
    [36] Laskar J, Robutel P, Joutel F, et al. A long-term numerical solution for the insolation quantities of the Earth[J]. Astronomy & Astrophysics, 2004, 428(1): 261-285.
    [37] Zeebe R E, Lourens L J. Geologically constrained astronomical solutions for the Cenozoic era[J]. Earth and Planetary Science Letters, 2022, 592: 117595.
    [38] Fang Q, Wu H C, Hinnov L A, et al. A record of astronomically forced climate change in a Late Ordovician (Sandbian) deep marine sequence, Ordos Basin, North China[J]. Sedimentary Geology, 2016, 341: 163-174.
    [39] Waltham D. Milankovitch period uncertainties and their impact on cyclostratigraphy[J]. Journal of Sedimentary Research, 2015, 85(8): 990-998.
    [40] Svensen H H, Hammer Ø, Corfu F. Astronomically forced cyclicity in the Upper Ordovician and U-Pb ages of interlayered tephra, Oslo region, Norway[J]. Palaeogeography, Palaeoclimatology, Palaeoecology, 2015, 418: 150-159.
    [41] Hinnov L A. New perspectives on orbitally forced stratigraphy[J]. Annual Review of Earth and Planetary Sciences, 2000, 28: 419-475.
    [42] Gradstein F M, Ogg J G, Schmitz M D, et al. Geologic time scale 2020[M]. Amsterdam: Elsevier, 2020: 631-694.
    [43] Zhong Y Y, Wu H C, Zhang Y D, et al. Astronomical calibration of the Middle Ordovician of the Yangtze Block, South China[J]. Palaeogeography, Palaeoclimatology, Palaeoecology, 2018, 505: 86-99.
    [44] Nielsen A. Ordovician sea level changes: A baltoscandian perspective[M]//Webby B, Paris F, Droser M, et al. The great Ordovician biodiversification event. Columbia: Columbia University Press, 2004: 84-94.
    [45] Vandenbroucke T R A, Armstrong H A, Williams M, et al. Ground-truthing Late Ordovician climate models using the paleobiogeography of graptolites[J]. Paleoceanography, 2009, 24(4): PA4202.
    [46] Vandenbroucke T R A, Armstrong H A, Williams M, et al. Epipelagic chitinozoan biotopes map a steep latitudinal temperature gradient for earliest Late Ordovician seas: Implications for a cooling Late Ordovician climate[J]. Palaeogeography, Palaeoclimatology, Palaeoecology, 2010, 294(3/4): 202-219.
    [47] Nardin E, Godderis Y, Donnadieu Y, et al. Modeling the Early Paleozoic long-term climatic trend[J]. Geological Society of America Bulletin, 2011, 123(5/6): 1181-1192.
    [48] Turner B R, Armstrong H A, Wilson C R, et al. High frequency eustatic sea-level changes during the middle to early Late Ordovician of southern Jordan: Indirect evidence for a Darriwilian ice age in Gondwana[J]. Sedimentary Geology, 2012, 251-252: 34-48.
    [49] Pohl A, Donnadieu Y, Le Hir G, et al. Glacial onset predated Late Ordovician climate cooling[J]. Paleoceanography, 2016, 31(6): 800-821.
    [50] Zachos J C, Shackleton N J, Revenaugh J S, et al. Climate response to orbital forcing across the Oligocene-Miocene boundary[J]. Science, 2001, 292(5515): 274-278.
  • 加载中
通讯作者: 陈斌, bchen63@163.com
  • 1. 

    沈阳化工大学材料科学与工程学院 沈阳 110142

  1. 本站搜索
  2. 百度学术搜索
  3. 万方数据库搜索
  4. CNKI搜索

Figures(5)  / Tables(1)

Article Metrics

Article views(80) PDF downloads(27) Cited by()

Proportional views
Related
Publishing history
  • Received:  2022-11-04
  • Revised:  2022-12-30
  • Accepted:  2023-02-16
  • Published:  2025-02-10

Cyclostratigraphy of the Ordovician Saergan Formation in the Tarim Basin

doi: 10.14027/j.issn.1000-0550.2022.165
Funds:

National Natural Science Foundation of China 41925010

National Natural Science Foundation of China 42072039

Abstract: Objective The Middle-Upper Ordovician Saergan Formation in the Tarim Basin represents an important hydrocarbon source rock deposited in a marine environment. However, the current model of the deposition of the Saergan Formation remains nebulous. High-precision geochronologic constraints may shed new light on the deposition history of the Saergan Formation. Methods The identification of Milankovitch cycles, in particular, a 405 ka long orbital eccentricity cycle, can be used to construct precise time scales for the sedimentary succession of the Paleozoic Era. The magnetic susceptibility (MS) is a measure of the degree of magnetization of a material in response to an applied magnetic field, which can be a powerful tool for cyclostratigraphy and paleoclimate studies. Here, a total of 701 MS measurements from the 9 m Saergan Formation in the Subashigou section of the Kalpin area, Aksu city, Xinjiang were obtained to conduct a cyclostratigraphic analysis, including a multitaper method spectral analysis, an evolutive harmonic analysis, and bandpass filtering. Results The spectral analyses show significant peaks at 0.74-1.28 m, 0.2-0.27 m, 0.057-0.071 m, and 0.035-0.039 m with ratios of 21.14∶1, 7.71∶1, 5.71∶1, 1.86∶1, and 1.11∶1, which are close to those of the Middle-Late Ordovician astronomical cycles. Although there is no reliable astronomical solution for the Ordovician period, astronomical calibration can be achieved using a stable 405 ka eccentricity cycle. After the 405 ka long eccentricity calibration, the spectral analysis shows periods with 100 ka (short eccentricity), 30.6-31.2 ka (obliquity), and 20-21.8 ka (precession). Ten eccentricity cycles are obtained using bandpass filtering and a “floating” astronomical time scale with a duration of ~3.9 Ma is established for the Saergan Formation of the Subashigou section. An amplitude modulation (AM) envelope of the interpreted 30.6 ka band of the 405 ka calibrated MS time series reveals long-term cycles with a period of ~1.2 Ma for the Ordovician, which is identical with that at present. The first appearance datum (FAD) of the graptolite Nemagraptus. gracilis is used as a tie point for building the correlation between the Subashigou section and Dawangou section (Global Stratotype Section and Point auxiliary Stratotype of the Sandbian). The results show that the initiation of deposition of the Saergan Formation in the Subashigou section was ~1.03 Ma later than that in the Dawangou section. This supports the assertion that the Saergan black shales developed during a strong sea-level transgression process, which drowned the platform, and organic-rich sediments were deposited on the carbonate platform. Based on a further comparison among the MS series, 1.2 Ma obliquity cycle, and global sea-level curve during the Middle-Late Ordovician, we suggest that the 1.2 Ma long obli-quity cycle may have controlled the sea-level changes during the time of the Saergan Formation deposition. Ice accumulation at the million year scale can be explained by a sustained reduction of ice melting in cool high-latitude summers during an interval of a series of reduced obliquity variations (minima of the long term obliquity cycle). Conclusions In summary, the orbitally forced formation of the Saergan Formation is confirmed and a possible model of the deposition process of the Saergan shale is proposed based on the high-resolution cyclostratigraphy study in this study.

GAO Yuan, REN ChuanZhen, FANG Qiang, WU HuaiChun, SHI MeiNan, ZHANG ShiHong, YANG TianShui, LI HaiYan. Cyclostratigraphy of the Ordovician Saergan Formation in the Tarim Basin[J]. Acta Sedimentologica Sinica, 2025, 43(1): 88-98. doi: 10.14027/j.issn.1000-0550.2022.165
Citation: GAO Yuan, REN ChuanZhen, FANG Qiang, WU HuaiChun, SHI MeiNan, ZHANG ShiHong, YANG TianShui, LI HaiYan. Cyclostratigraphy of the Ordovician Saergan Formation in the Tarim Basin[J]. Acta Sedimentologica Sinica, 2025, 43(1): 88-98. doi: 10.14027/j.issn.1000-0550.2022.165
  • 塔里木盆地中—上奥陶统萨尔干组是一套滞留盆地相沉积地层[12],是我国著名的海相烃源岩之一[35]。前人从岩石学、地球化学、地球物理学、层序地层学等方面对萨尔干组页岩进行广泛的研究[1,611],并为萨尔干组黑色页岩的形成提出两种可能的沉积模式,分别为海侵模式和海退模式[12]。海侵模式认为萨尔干组沉积于明显的海侵过程,海水逐渐淹没碳酸盐台地的同时,富含有机质的沉积物在台地上堆积形成黑色页岩;海退模式则倾向萨尔干组形成于海退过程,该过程使盆地与开阔海洋沟通变差,底层水循环减弱,导致富含有机质的沉积物形成黑色页岩[12]。全球广泛分布的与萨尔干组同时期的富含有机质黑色页岩似乎证实了海侵模式[1314],但柯坪地区不同剖面间碳同位素的变化趋势与该模式相矛盾[12]。由大湾沟组灰岩到萨尔干组黑色页岩的岩性突变被认为是海平面下降使得盆地与开阔海洋沟通变差,底层水缺氧导致,这是海退模式的主要证据。但是,上奥陶统最底部Nemagraptus gracilis笔石带并未在柯坪地区四石场剖面识别出,关键生物带的缺失不支持这种解释[16]。因此,岩性、生物和化学地层学等结果的不吻合,使得准确判断萨尔干组沉积模式更为困难[12]。高精度的地质年代可以约束萨尔干组的沉积时限,实现高精度的区域地层对比,为萨尔干组的沉积模式提供更高分辨率的年代学证据。

    旋回地层学通过识别和解释地层中保存的由地球轨道力(如偏心率、斜率和岁差旋回)控制的(准)周期性沉积旋回信号,建立精度可达20~400 ka的天文年代标尺,从而精确约束各种地质事件及地质过程的绝对年代和持续时间[17]。前人在中—晚奥陶世旋回地层学研究中取得显著成果[1819],在此期间发生的气候变冷和碳同位素漂移等重大事件均被证明可能与地球轨道旋回控制的古气候变化有关[1920]。目前,~1.2 Ma超长斜率旋回已经被证明是奥陶纪气候和冰川—海平面变化的重要驱动因素之一[1819]

    前人已经对塔里木盆地大湾沟剖面萨尔干组进行详细的旋回地层学研究,建立的高精度天文年代标尺,为中—晚奥陶世提供了高分辨率的年代地层框架[18]。本文对塔里木盆地苏巴什沟剖面中—上奥陶统萨尔干组进行系统样品采集并进行质量磁化率测试,利用获得的数据开展详细的旋回地层学研究,识别剖面地层中记录的米兰科维奇旋回,利用地质历史时期稳定的405 ka长偏心率旋回建立高精度的天文年代标尺,旨在:(1)实现40万年偏心率时间尺度上萨尔干组的地层对比;(2)确定萨尔干组的沉积模式;(3)探讨萨尔干组沉积时期海平面变化驱动机制。

  • 塔里木盆地位于中国的西北部,面积约占5.6×10⁵ km2,是世界上最大的内陆盆地之一。其内部主要被塔克拉玛干沙漠所覆盖,露头仅见于西北部和东北部地区(图1b)。塔里木盆地发源于前震旦纪陆壳基底[10],古生代位于冈瓦纳大陆和劳伦大陆之间的古特提斯洋[22]。中—晚奥陶世,塔里木盆地位于北半球冈瓦纳大陆西北缘,毗邻西伯利亚、华南、华北以及澳大利亚板块[2324](图1a)。前人将塔里木盆地分为十二个一级构造单元,分别为三个隆起(塔北隆起、中央隆起和塔南隆起)、五个坳陷(库车坳陷、北部坳陷、西南坳陷、东南坳陷和塘古孜巴斯坳陷)和四个边缘断隆构造(柯坪断隆、库鲁克塔格断隆、铁克力克断隆和阿尔金山断隆)[25]。研究剖面所在的柯坪地区位于中央隆起的西部,奥陶纪属于斜坡相沉积环境[1,12]。该地区沉积层序所对应的海进—海退旋回结构在塔里木盆地范围内可以很好地对比,并且与全球海平面变化曲线类似,反映了该地区沉积地层的发育受到全球海平面变化的控制[10]

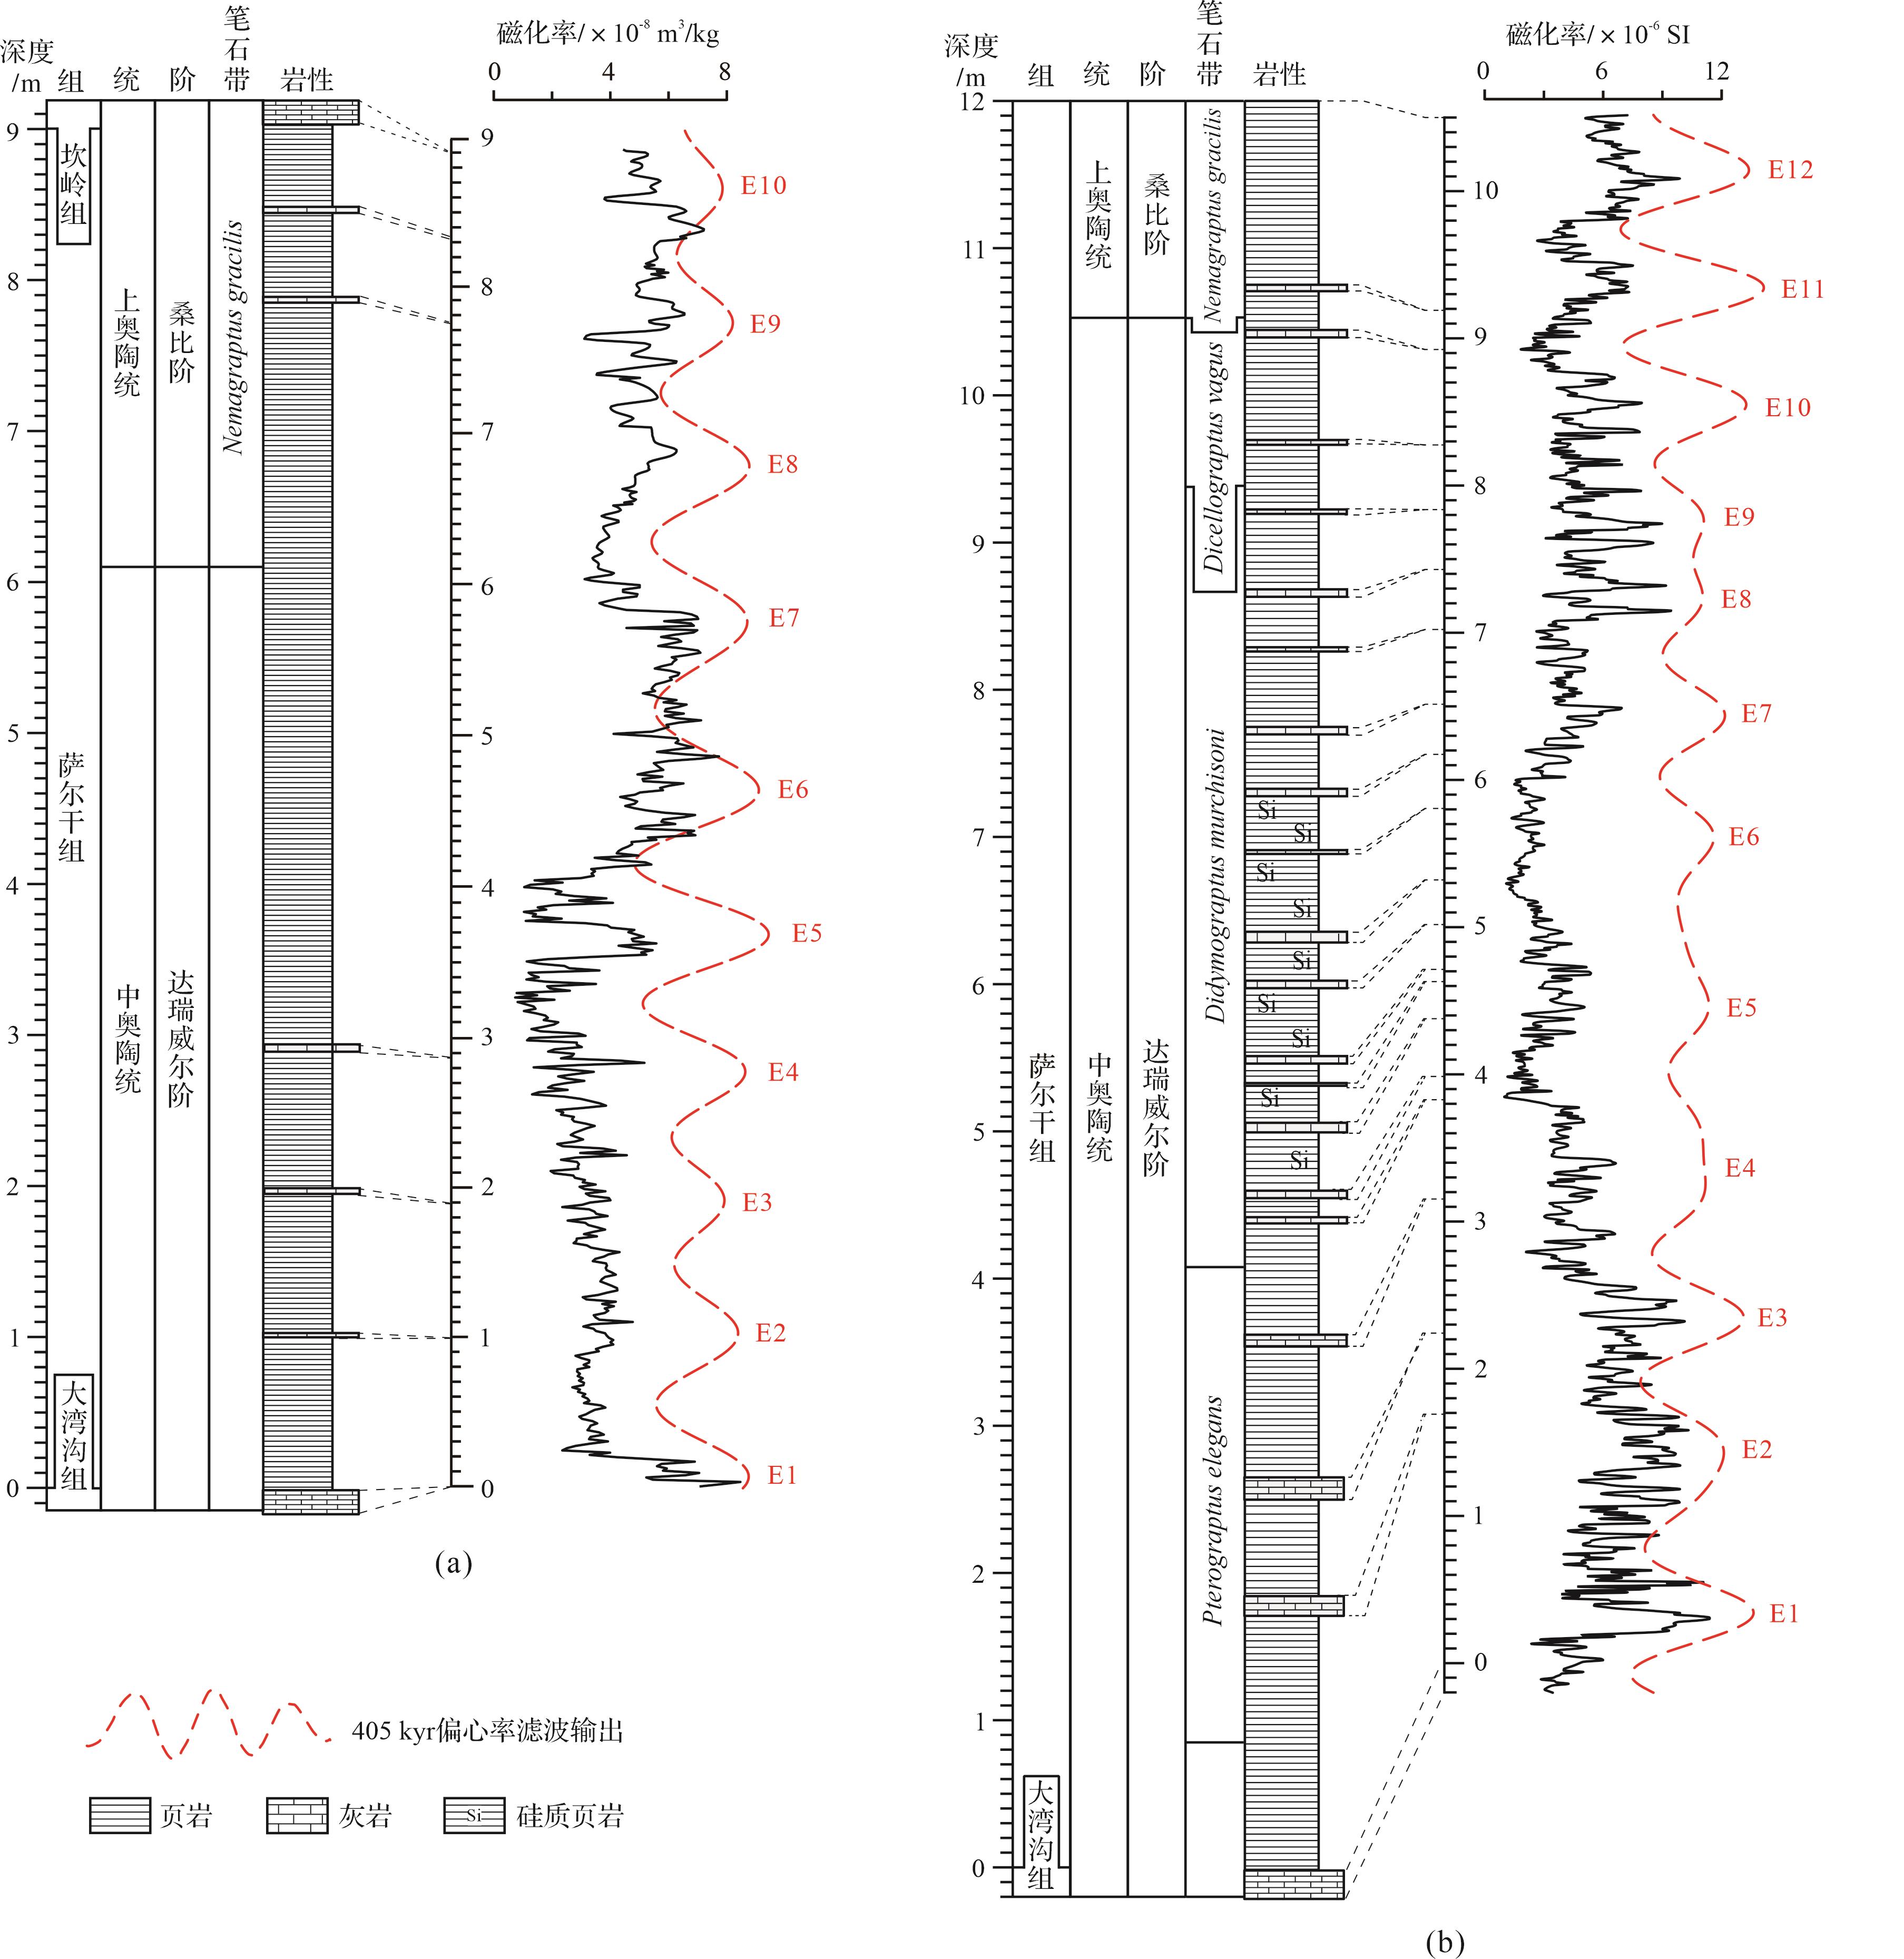
    塔里木盆地萨尔干组出露厚度为6.0~13.0 m,岩性为夹少量灰岩薄层或透镜体的黑色碳质泥页岩,局部含有少量泥质条带[15]。在柯坪地区沿北东—南西向出露于苏巴什沟以东、四石厂以西、沙井子—三岔口以北以及乌什以南等地[26]。萨尔干组产出四个笔石带,从下到上依次为Pterograptus elegans带、Didymograptus murchisoni带、Dicellograptus vagus带和Nemagraptus gracilis[16],其时代为奥陶纪达瑞威尔晚期到桑比早期(图1c)。本文研究的苏巴什沟地区(地理坐标为40°35′27″ N,78°57′20″ E)是所有产出萨尔干组沉积序列中最西端的剖面[1]。苏巴什沟剖面从底部到顶部依次出露大湾沟组、萨尔干组和坎岭组。其中萨尔干组厚度为9.0 m(图2a),岩性主要为黑色页岩夹薄层灰岩透镜体,与下伏大湾沟组薄层灰岩和上覆坎岭组灰岩界线清晰且均为整合接触,夹于萨尔干组上部和下部的薄层灰岩差异显著,下部可见泥粒灰岩或颗粒灰岩,上部主要为含生屑泥质灰岩[1]N. gracilis带首次出现层位(first appearance datum,FAD)为桑比阶的底界[12],苏巴什沟剖面N. gracilis带FAD大致在萨尔干组6.1 m处[16]图2a)。

    Figure 2.  Lithostratigraphy, biostratigraphy, cyclostratigraphy, and magnetic susceptibility data series

    大湾沟剖面(40°43′16″ N,79°31′51″ E)在2000年被推荐为上奥陶统底界全球辅助层型剖面[14],是目前萨尔干组实测厚度最大、研究程度最高的剖面[1](图1b)。该剖面位于苏巴什沟剖面东北约50 km处的柯坪县印干村西北侧,该剖面的萨尔干组实测厚度为12.0 m,由黑色页岩夹灰黑色薄层或透镜状泥屑灰岩组成。沿大湾沟剖面,海相地层从大坪阶到凯迪阶中部连续出露,依次为大湾沟组、萨尔干组、坎岭组和印干组(图1c)。在大湾沟剖面的萨尔干组黑色页岩中还可见草莓状黄铁矿[1]。大湾沟剖面萨尔干组的旋回地层学结果已经由前人发表[18],作为本研究对比依据。

  • 磁化率(magnetic susceptibility,MS)是衡量一个物质被磁化难易程度的无量纲岩石磁学参数。通常情况下,经测试的样品磁化率为岩石中各种磁性矿物(顺磁性、反磁性和铁磁性矿物)的磁化率值总和[27]。磁化率值的变化可以作为陆源输入的指标[2829]。在海相地层中,当日照量处于较高(低)阶段时,气温升高(降低),降水增加(减少),地表径流增强(减弱),因此岩石磁化率值较高(低)。磁化率的变化还能够记录冰期—间冰期旋回以及更高频的气候振荡等[3031]

    苏巴什沟剖面萨尔干组厚9.0 m,野外共计采集701个样品。马璐等[1]对大湾沟剖面和苏巴什沟剖面萨尔干组灰岩夹层进行沉积微相分析,结果表明这些灰岩形成于斜坡上部的浅水灰岩沉积区,经重力流作用后被运移到此处,属于异源钙质浊积岩,因此本文将苏巴什沟剖面萨尔干组0.99~1.02 m、1.89~1.92 m、2.91~2.94 m、7.80~7.82 m、8.40~8.42 m采集的灰岩数据移除,从而排除异源钙质浊积岩的影响(图2)。合理的采样间距可以确保采集的样品数据记录所需天文周期的最高频率信号[32]。根据Nemagraptus gracilis等笔石生物年代框架的约束[15]和对大湾沟剖面萨尔干组页岩0.19 cm/ka沉积速率的估计[18],对苏巴什沟剖面萨尔干组以1~2 cm间距采样。将浊积岩移除后的沉积序列共8.9 m,对野外采集样品进行碎样装塑料方盒,使用中国地质大学(北京)古地磁实验室MFK1-FA卡帕桥磁化率仪测得数据。大湾沟剖面的磁化率数据源于Fang et al.[18]

  • 剖面移除灰岩后的数据序列为8.9 m,共测得691组数据,对其进行间隔为0.013 m的线性插值。使用Matlab软件中的smooth.m函数,采用“moving”方法计算并去除大于1.3 m的长周期和趋势,保留高频旋回信号[32]。为了识别米兰科维奇信号,对插值、平滑处理后的等间距深度域序列进行多窗口频谱(Multi-Taper Method,MTM)分析[33],同时对预处理后的序列进行滑动频谱分析来确定不同深度的周期分布特征[27]。利用稳定的405 ka周期建立年龄模型,在Matlab中通过depthtotime.m函数[27]将磁化率深度域序列转换为时间序列。对获得的时间域序列进行频谱分析和带通滤波分析的天文旋回检验。除滤波分析在R[34]的“Astrochron”软件包中的“Bandpass”函数[35]下执行外,其余分析均在Matlab中完成。

  • 奥陶纪虽然没有可靠的天文解决方案,但利用地质历史时期稳定的405 ka长偏心率周期[3637],可以实现天文校准。Fang et al.[38]在华北板块上奥陶统平凉组中,识别出的斜率周期为30.6 ka,岁差周期为19.6 ka和16.3 ka。塔里木盆地大湾沟剖面的中—晚奥陶世萨尔干组记录的短偏心率、斜率和岁差周期分别为100 ka、31 ka和~20 ka[18]。前人计算出,458.4 Ma时地球斜率周期为33.2±3.8 ka,岁差周期为20.8±1.5 ka和17.0±1.1 ka[39]。Svensen et al.[40]从挪威奥斯陆地区获得斜率周期为30.3 ka,岁差周期为19.2 ka和16.3 ka,并得到了高精度锆石U-Pb年代学的支持。前人基于405 ka长偏心率校准获得的奥陶纪轨道周期与估算的天文轨道周期基本一致(表1),因此本文采用405 ka长偏心率周期进行校准。

    轨道参数周期/ka比值文献来源
    Ee2e1oP1P2
    4051249533.220.817.023.82∶7.53∶5.59∶1.95∶1.22∶1.00Waltham[39]
    4051249530.319.216.324.85∶7.85∶5.83∶1.86∶1.18∶1.00Svensen et al.[40]
    4051249530.619.616.324.85∶7.85∶5.83∶1.88∶1.20∶1.00Fang et al.[38]
    40512410031.020.020.25∶6.20∶5.00∶1.55∶1.00Fang et al.[18]
    注:405 ka长偏心率周期来源自文献[41]。

    Table 1.  Periods of Earth’s orbital cycles for the Ordovician and their ratios

  • 苏巴什沟剖面萨尔干组磁化率值整体在(1~8)×10-8 m3/kg之间变化,平均值为4.36×10-8 m3/kg。在0~3.5 m厚度范围内磁化率值先迅速降低,此后磁化率值缓慢下降,波动范围较小,整体处于低值状态;在3.5~5.8 m厚度范围内,磁化率值逐步升高后保持稳定,整体为趋势平稳的高值;5.8~9.0 m处磁化率值较前一段有所降低,磁化率值的变化幅度也较明显(图2a)。大湾沟剖面萨尔干组磁化率值的变化范围为(1~12)×10-6 SI,平均值为5.5×10⁻⁶ SI(图2b)。大湾沟剖面磁化率的变化趋势整体与苏巴什沟剖面的磁化率序列相似。苏巴什沟剖面在0~3.5 m处与大湾沟剖面2.4~6.0 m处磁化率均呈降低趋势,苏巴什沟剖面在3.5~5.8 m处与大湾沟剖面6.0~8.8 m处磁化率值均迅速达到高值并呈波动变化,在N.gracilis笔石的首现层位处,磁化率均为低值,以及苏巴石沟剖面6.0~9.0 m与大湾沟剖面9.0~10.5 m均具有两处明显峰值(图2)。苏巴什沟剖面与大湾沟剖面[18]具有相似的变化趋势,磁化率的高值对应了黑色页岩,磁化率的低值对应了夹杂薄层灰岩的页岩。

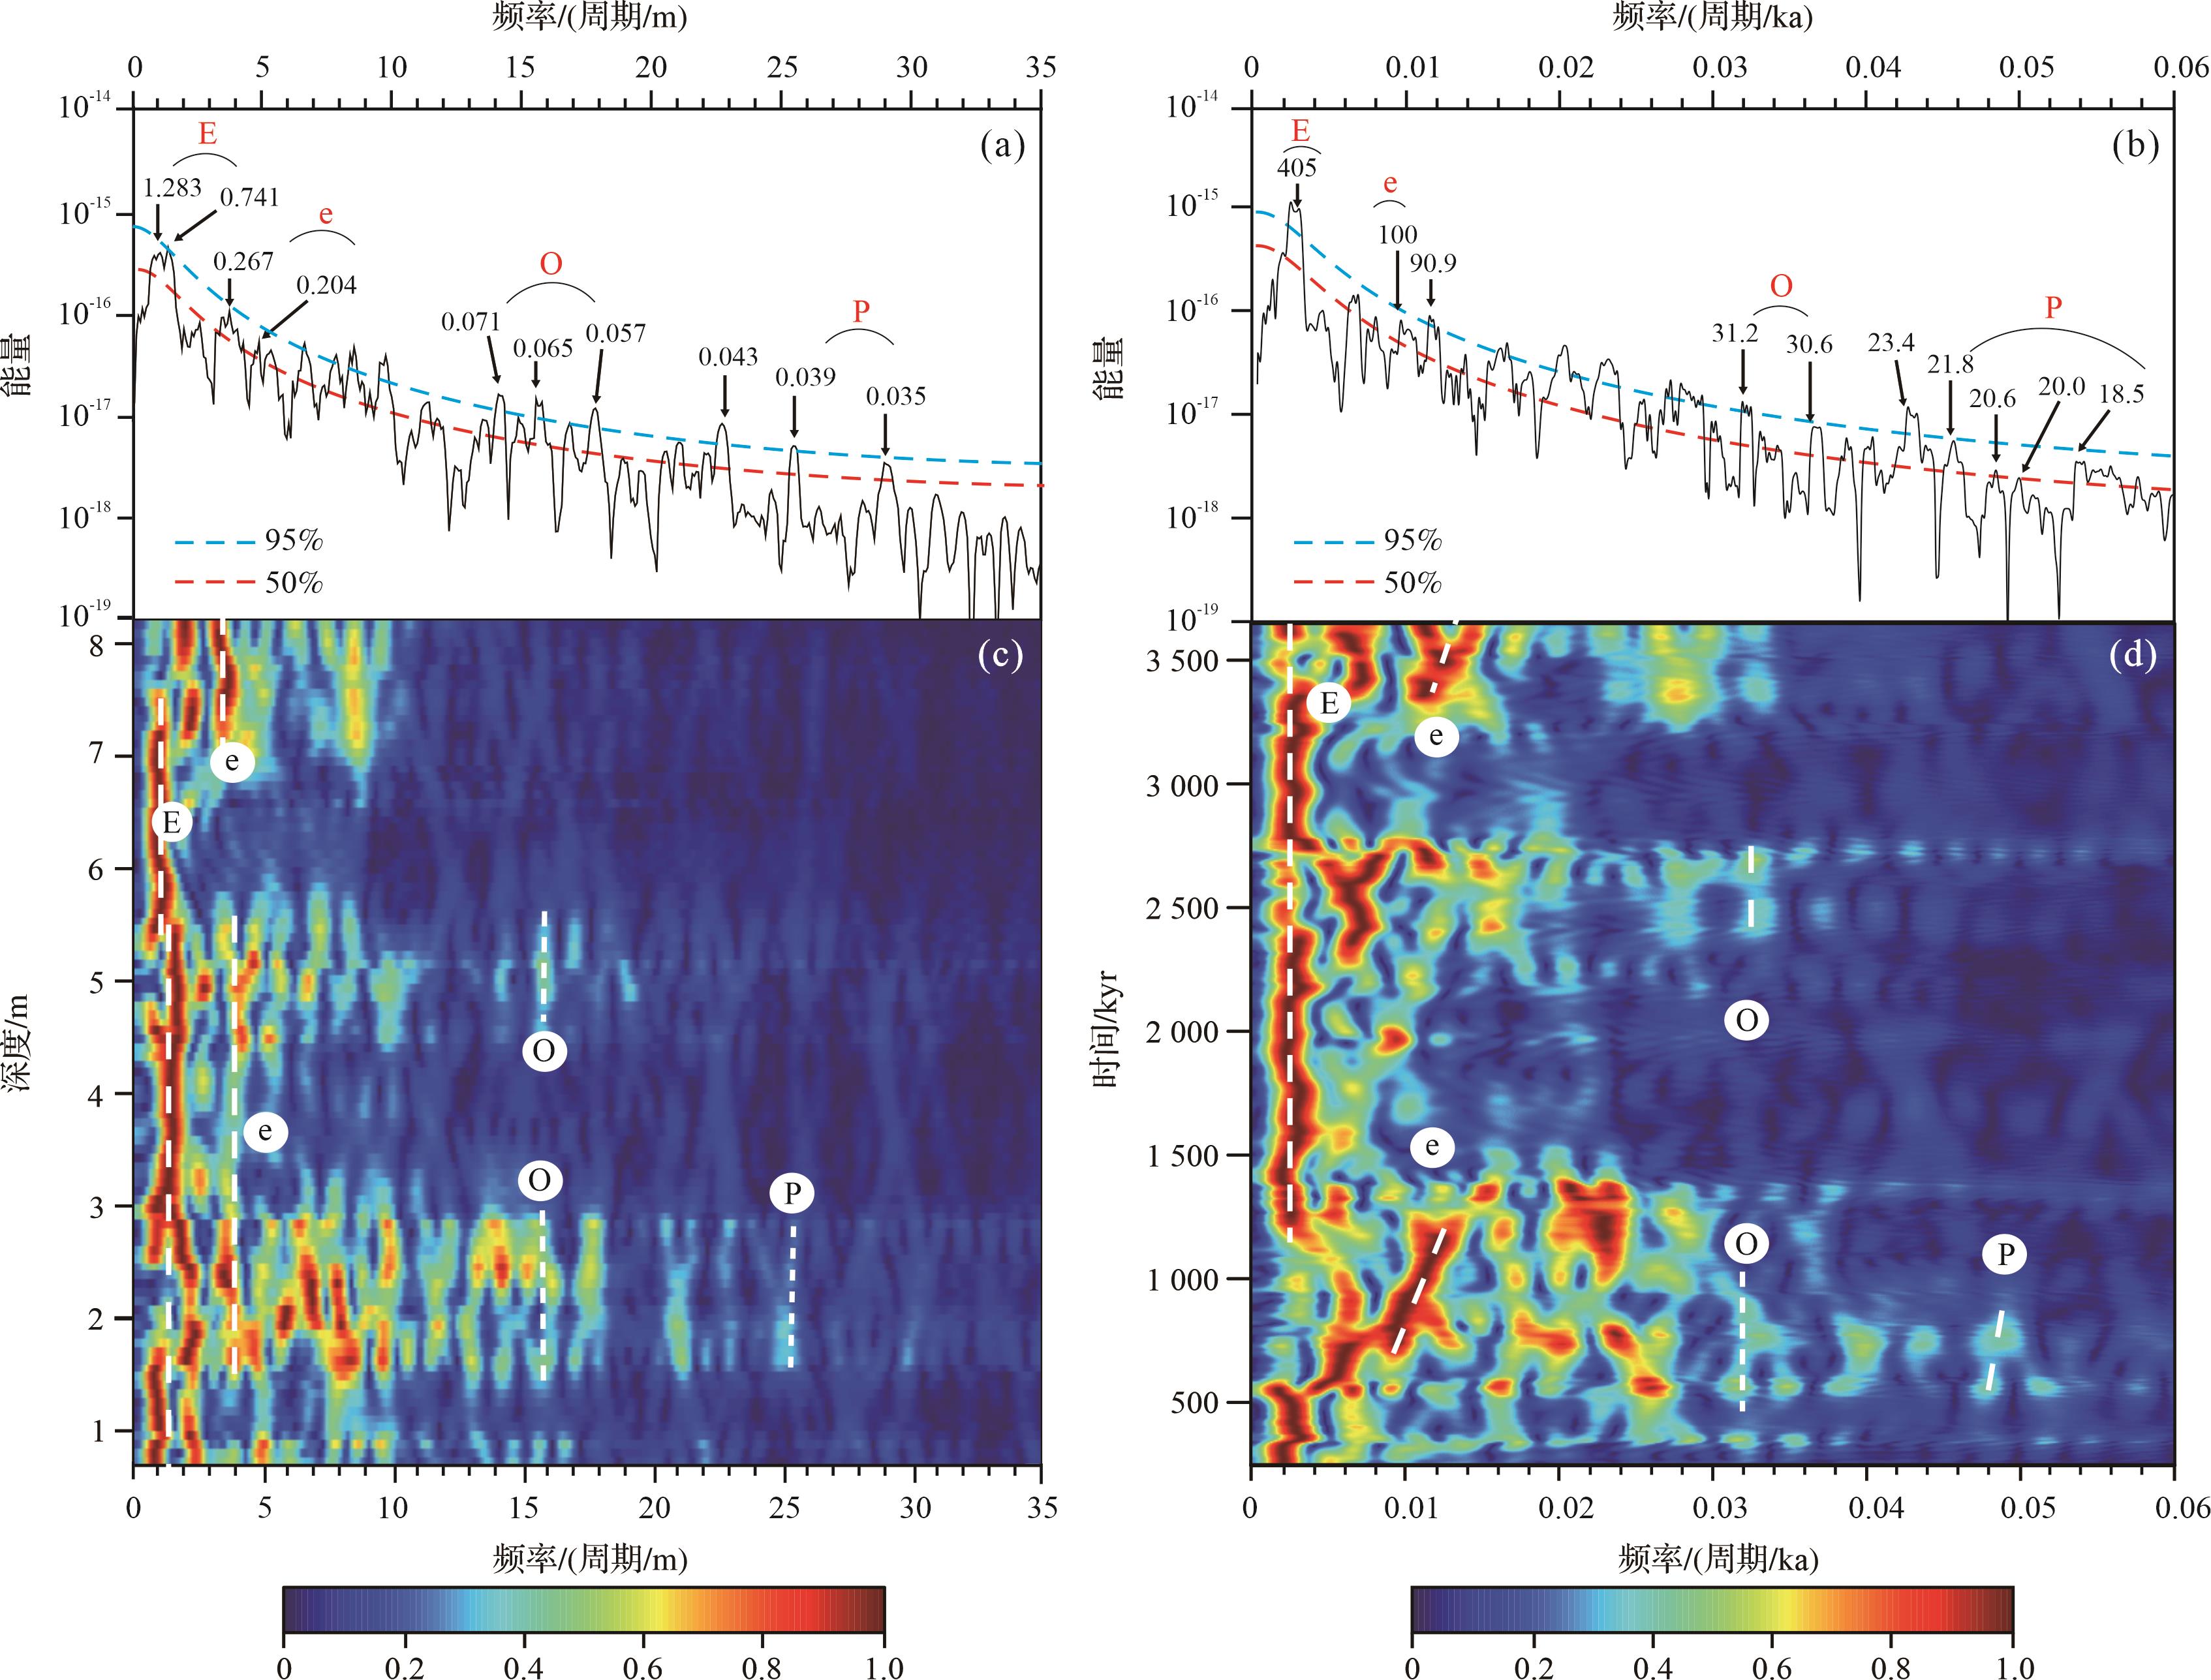
  • 对苏巴什沟剖面萨尔干组深度域磁化率序列进行频谱分析和滑动频谱分析,识别到多个高置信优势峰谱,分别在0.741~1.283 m、0.204~0.267 m、0.057~0.071 m和0.035~0.039 m具有优势峰值,其置信度均大于95%,在滑动窗口频谱分析中也可以找到对应的能量信号(图3a,b)。以上显著谱峰与Fang et al.[18]在大湾沟剖面识别的0.7~1.0 m、0.20~0.26 m、0.042~0.055 m和0.030~0.034 m的峰值接近。其比值约为21.14∶7.71∶5.71∶1.86∶1.11∶1,与前人预测的奥陶纪地球轨道参数周期吻合(表1),这些峰值可能分别代表长偏心率(E)、短偏心率(e)、斜率(O)和岁差(P)周期(图3a,b)。这表明苏巴什沟剖面萨尔干组的沉积可能受到了天文轨道力的控制。

    Figure 3.  Spectrum analysis and evolutive Fast Fourier Transform

  • 根据MTM频谱分析的结果,对苏巴什沟剖面深度域磁化率数据序列进行带通滤波,以提取地层中记录的长偏心率信号。苏巴什沟剖面滤波带宽为1.0±0.2旋回/m,大湾沟剖面滤波带宽为1.2±0.3旋回/m。滤波结果共识别出10个长偏心率旋回(图2a)。利用405 ka年龄模型进行天文调谐,将磁化率的深度域序列转化为时间域序列。为了检验旋回周期识别的合理性以及天文校准的可靠性,将校准后得到的磁化率时间序列进行频谱分析。苏巴什沟剖面时间域的频谱分析结果显示在405 ka、100 ka、31.2 ka、30.6 ka、21.8 ka、20.6 ka和20.0 ka处有显著波峰(图3c,d)。因此,根据405 ka年龄模型的天文校准,将剖面深度域序列转化为时间域序列,建立了苏巴什沟剖面萨尔干组~3.9 Ma的“浮动”天文年代标尺。

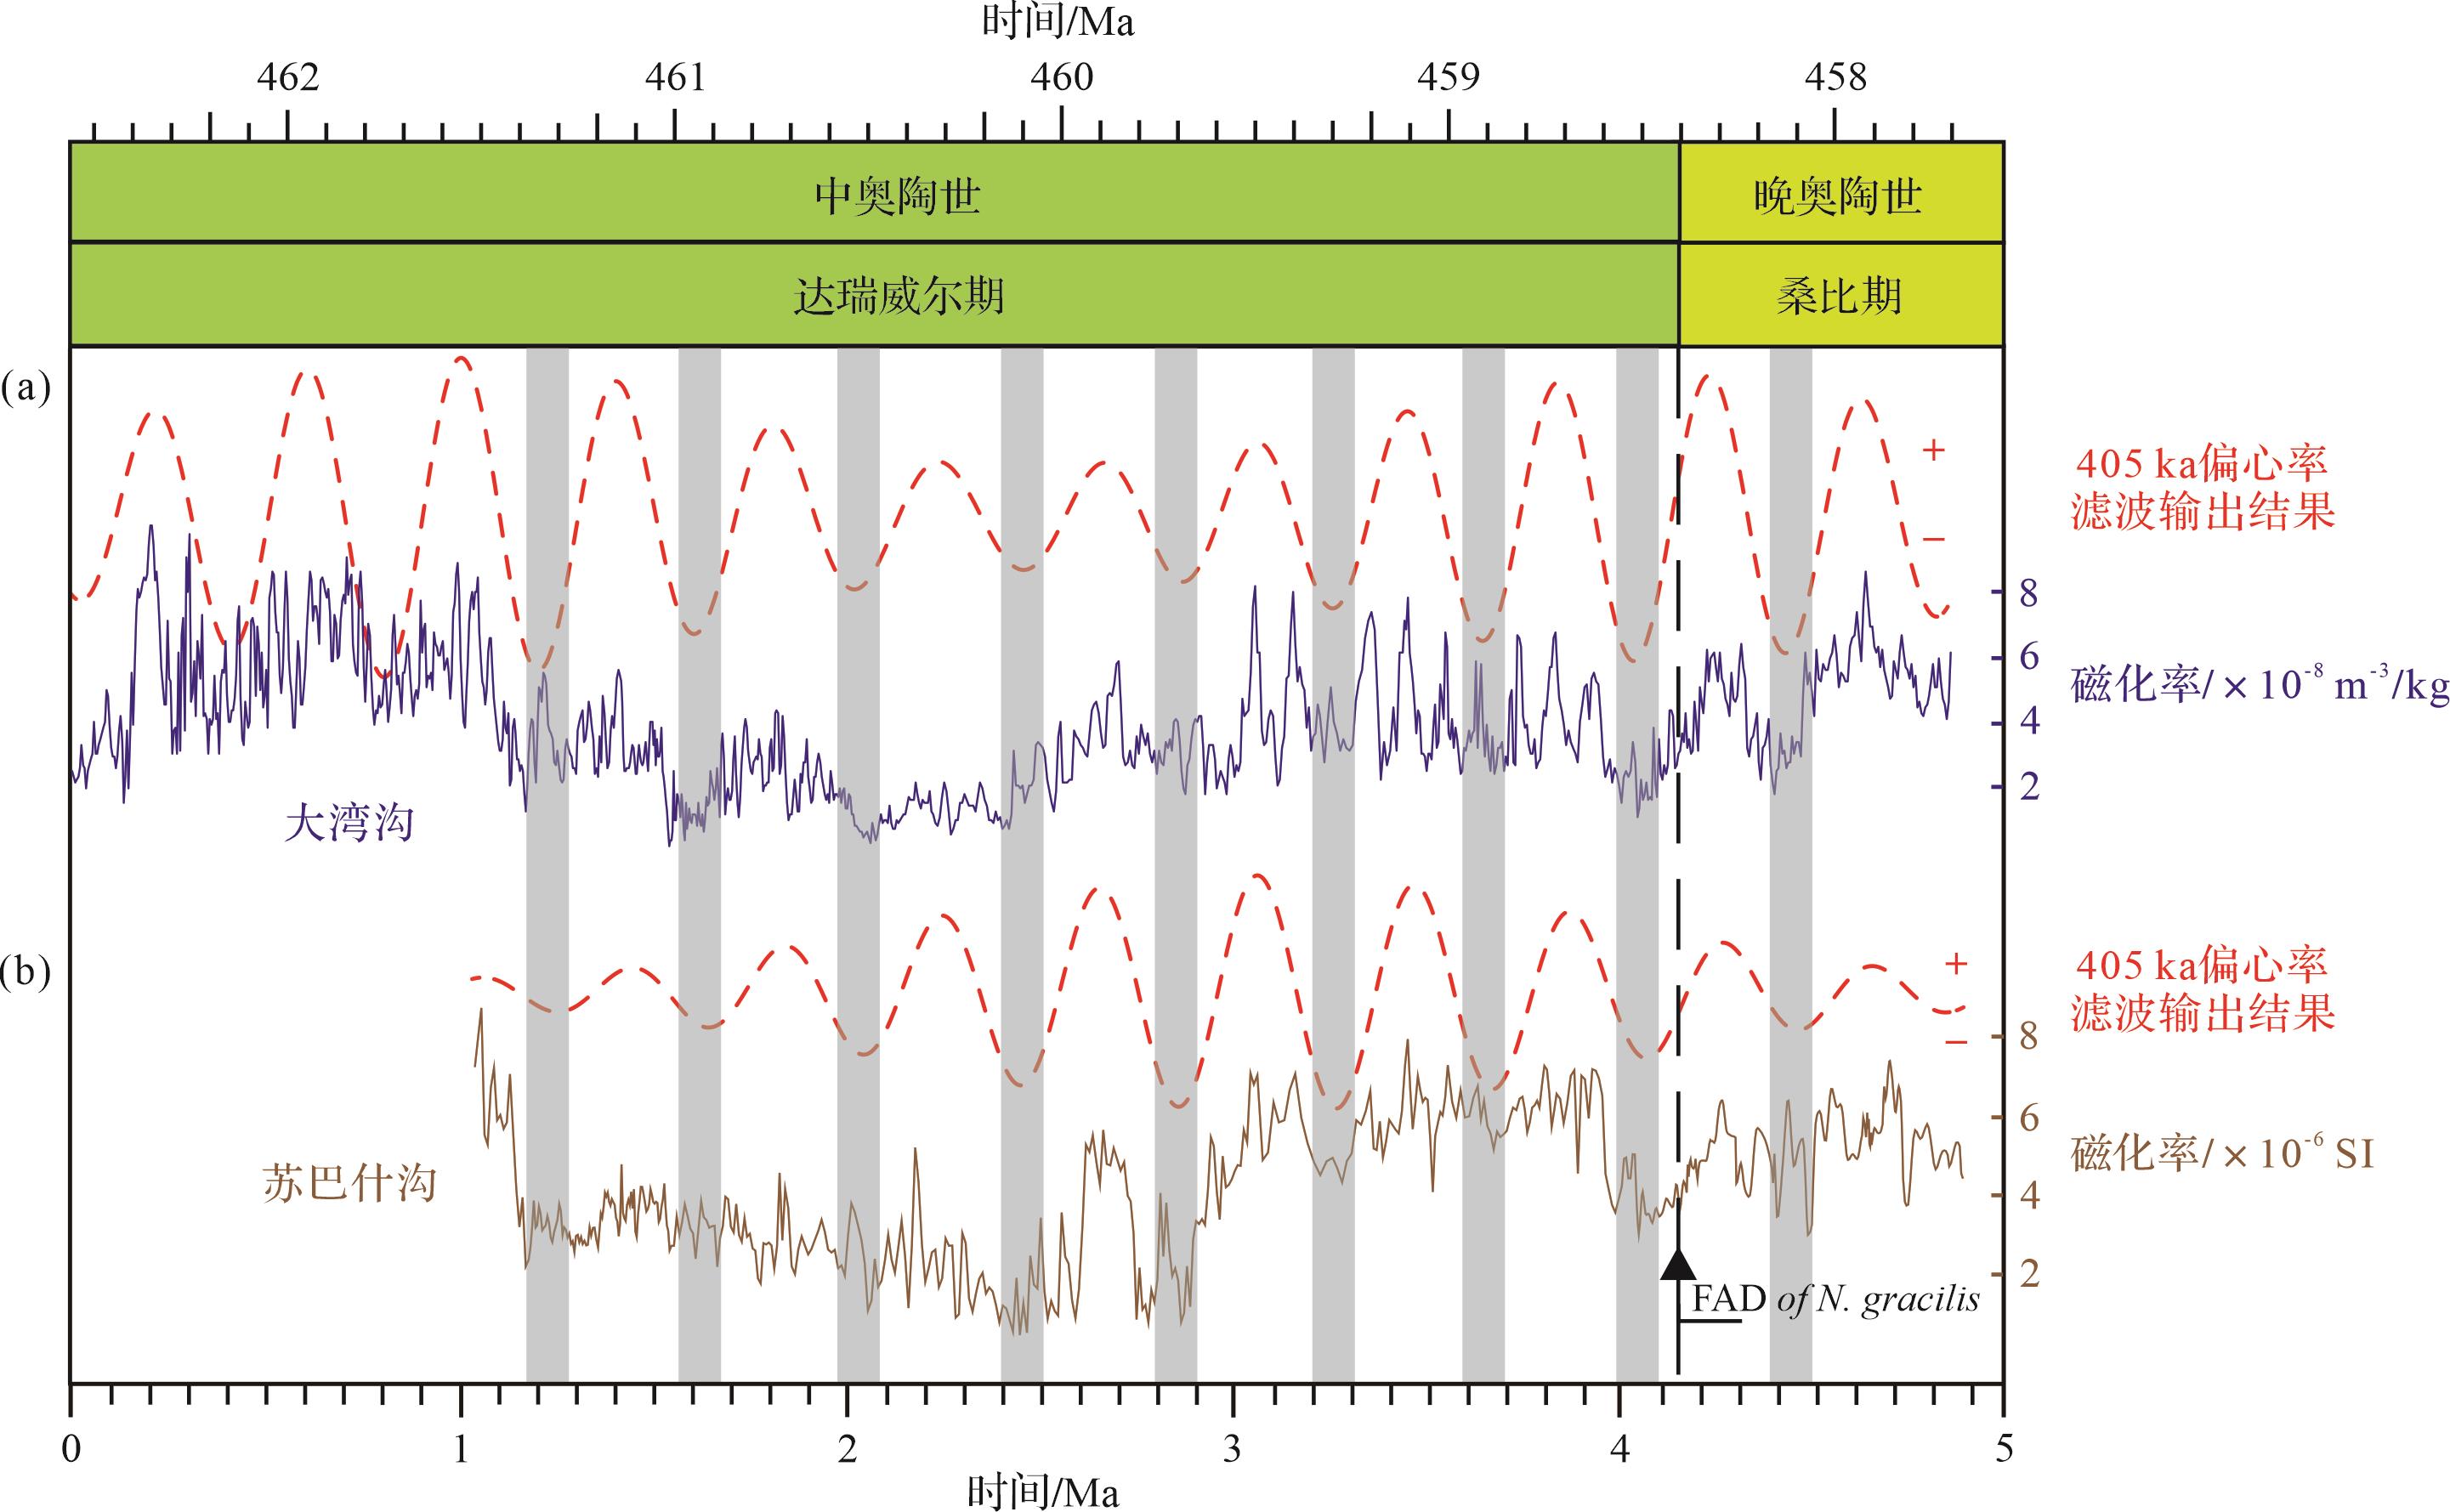
  • 柯坪地区和北部坳陷区阿瓦提断陷的萨尔干组是在快速海进背景下,发育于滞留盆地相的一套欠补偿的凝缩段沉积[12]。Fang et al.[18]依据N.gracilis笔石带的FAD对应于桑比阶底界(458.4 Ma),将大湾沟剖面的浮动天文年代标尺校准到国际地质年代标尺上。因此,将N.gracilis笔石带的首现层位作为基准,将两个剖面的天文年代标尺共同校准到国际地质年代表上进行剖面间对比(图4)。对比结果显示,不论是405 ka长偏心率周期的良好对应关系还是磁化率数据序列的变化趋势,均证实了两个剖面间萨尔干组高精度旋回地层对比的可靠性。

    Figure 4.  The constructed astronomical time scale and 405 ka filtering outputs

    根据校准结果显示,大湾沟剖面在462.5~461.5 Ma的磁化率值为高值,直到~460.1 Ma两个剖面的磁化率值一直呈缓慢下降趋势,振幅较小。此后两个剖面的磁化率值均呈上升状态,并且呈波动状变化(图4)。磁化率的降低已被证明是由于日照量增大,海平面升高所导致[43]。值得注意的是,萨尔干组上、下部夹层灰岩透镜体不同的微相也指示了海平面的上升。由西南至东北的方向,苏巴什沟和大湾沟剖面的萨尔干组下部的灰岩薄层微相中可见粗砂屑颗粒堆积层,指示海侵前相邻的浅海碳酸盐岩台地被机械搬运异地快速沉积成岩,上部的含生屑泥状灰岩可能代表海平面上升后在滞留盆地内的正常沉积[1]。萨尔干组沿柯坪—阿克苏一线经历了从无到有,从薄到厚的变化,同时下部灰岩透镜体夹层数量呈现大湾沟剖面多,苏巴什沟少的特点。夹层数量呈现大湾沟剖面多,苏巴什沟少的特点。前人在大湾沟的黑色页岩中观察到了草莓状黄铁矿[18],而在苏巴什沟剖面目前尚未发现,说明大湾沟剖面萨尔干组沉积于还原环境,指示大湾沟剖面相对苏巴什沟剖面萨尔干组更靠近下部,水体更深。

    综上所述,本文建立了中—晚奥陶世大湾沟剖面和苏巴什沟剖面的沉积古地理相对位置,并根据海平面升降关系,确定大湾沟剖面在~462.5 Ma时先开始沉积萨尔干组(图5a),随着海侵的进行,海平面不断上升,苏巴什沟剖面直到~461.5 Ma时萨尔干组才开始沉积(图5b),晚于大湾沟剖面~1.03 Ma。此后海平面短时间内虽略有下降,但整体仍为上升趋势,两个剖面萨尔干组均连续沉积至~457.7 Ma(图5c)。上述分析表明大湾沟和苏巴什沟剖面的萨尔干组在明显的海侵中先后接受沉积(图5),支持了前人所提出的海侵模式[12]

    Figure 5.  The sedimentary model in the Kalpin area during the Middle⁃Upper Ordovician

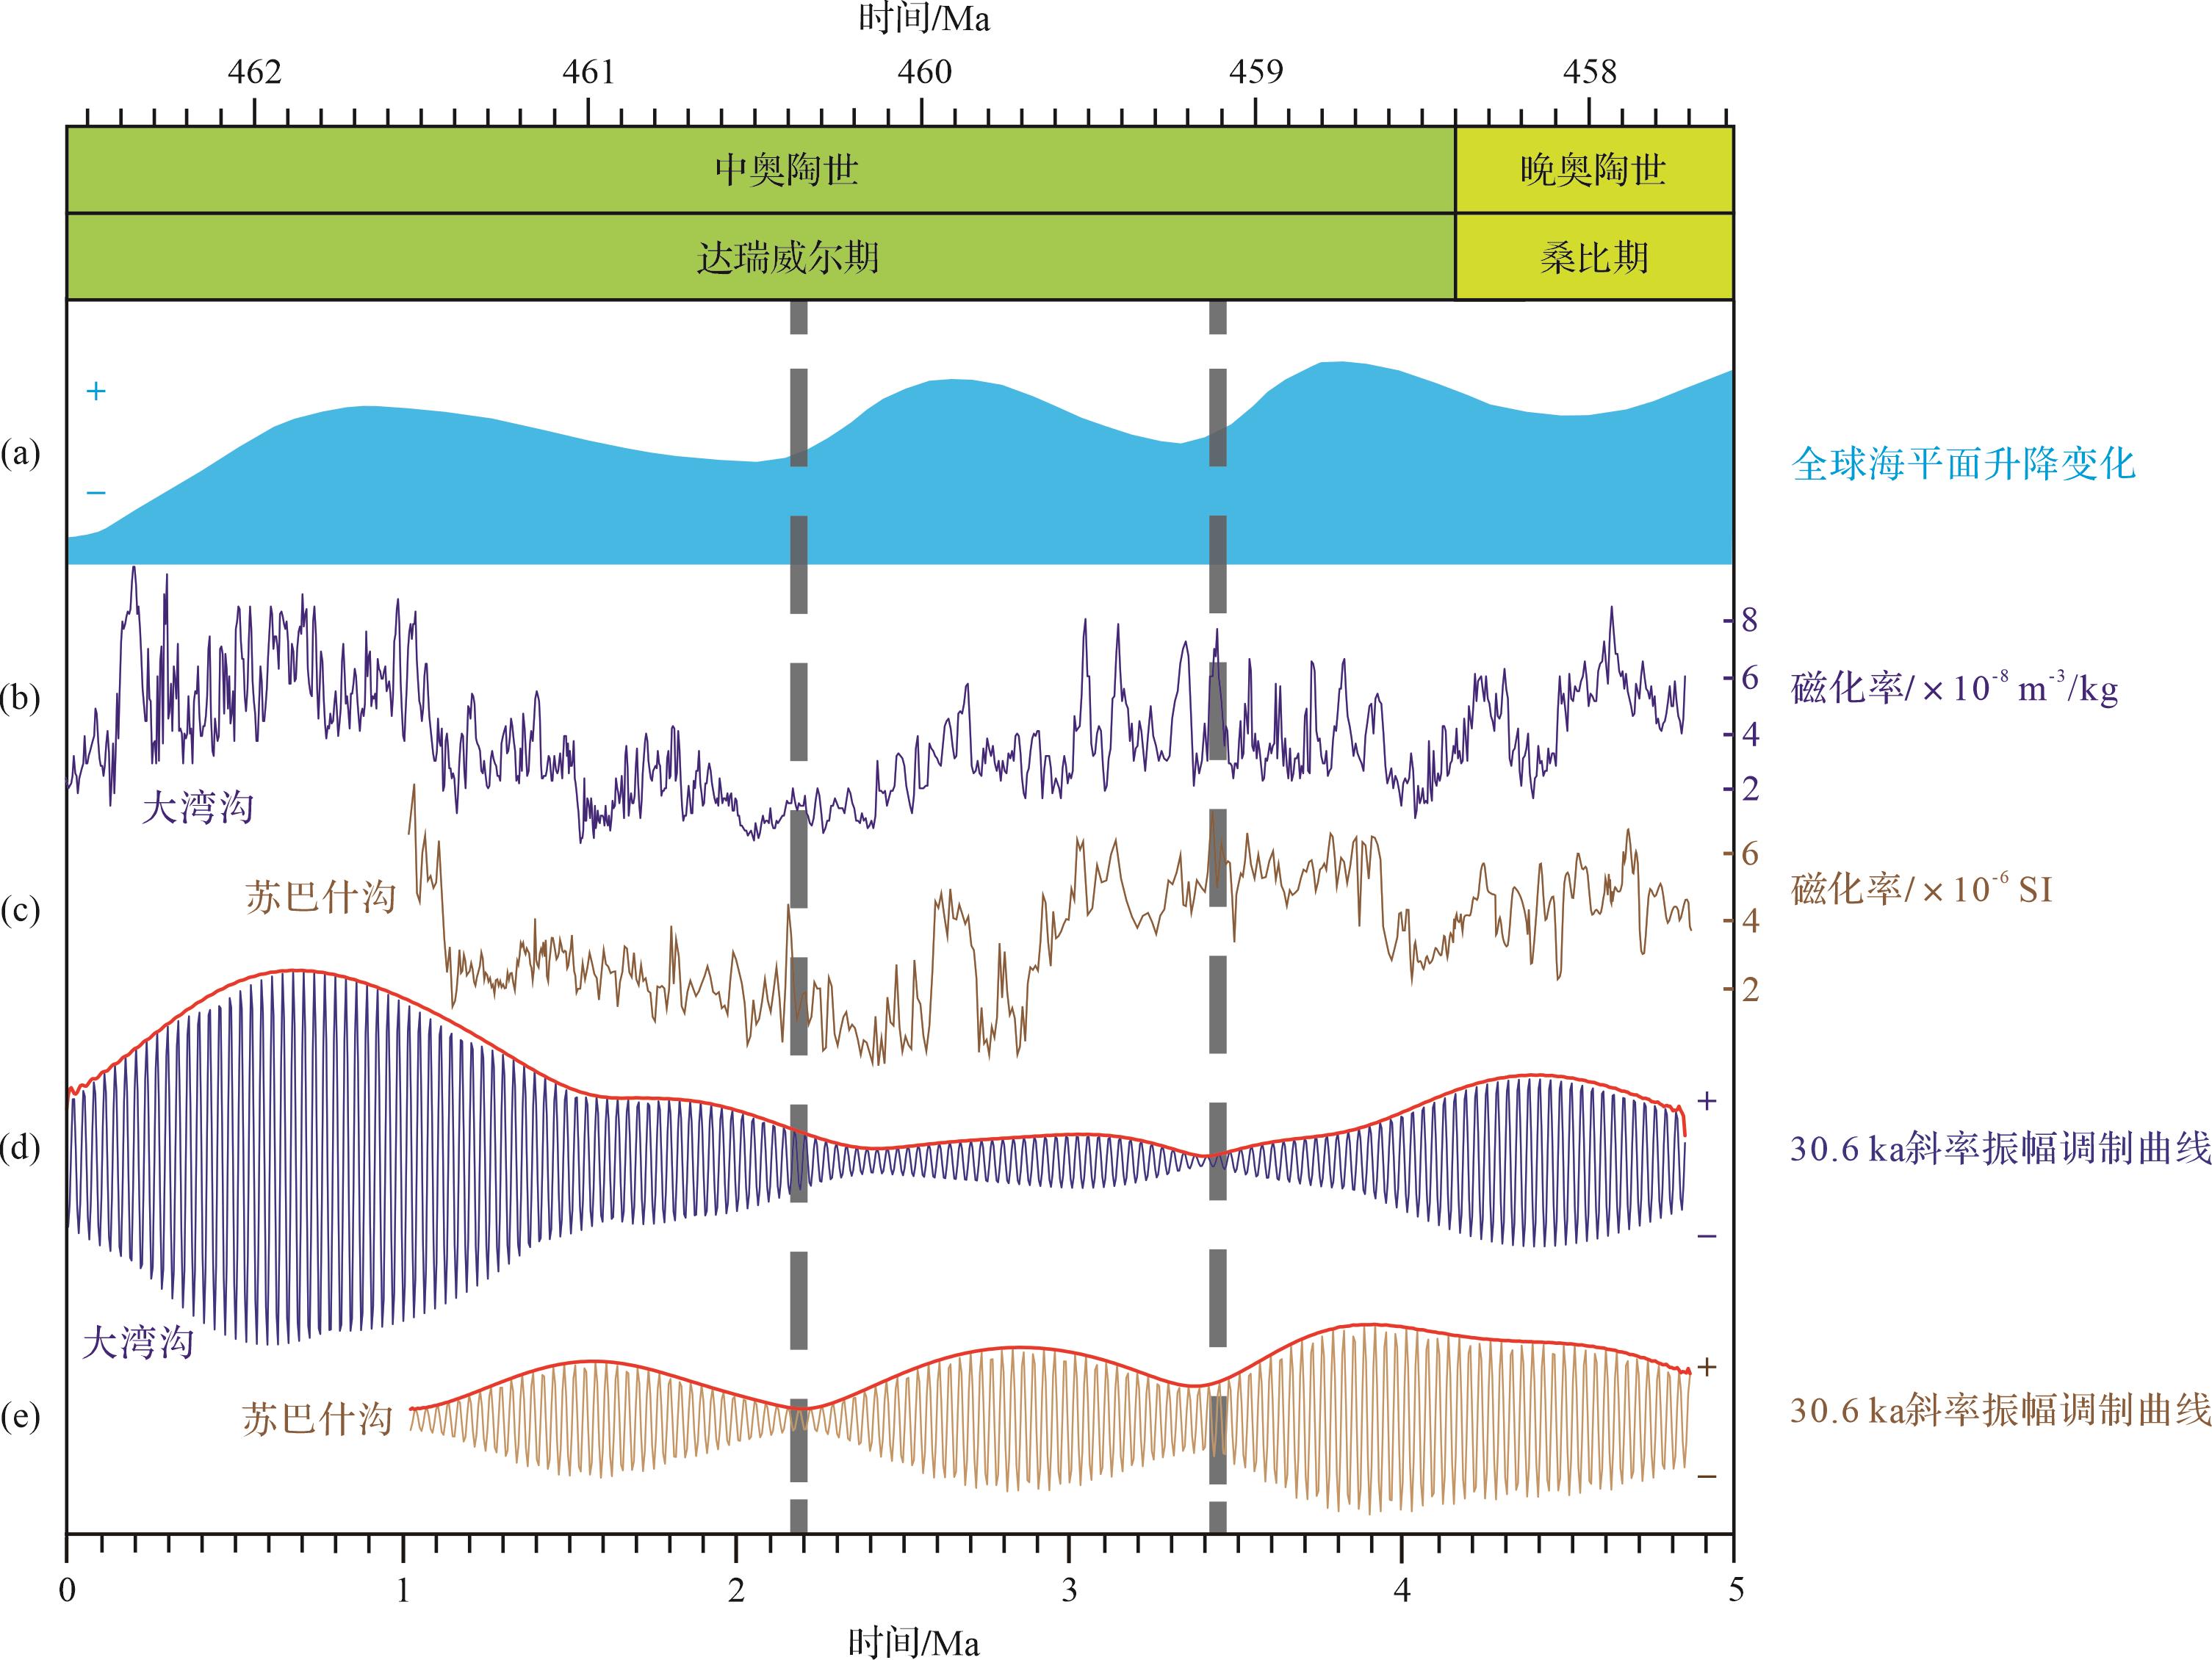
  • 生物地层学、层序地层学以及气候模拟等方面的大量研究均证明了中奥陶世冰川的存在[4449]。塔里木盆地苏巴什沟剖面萨尔干组黑色页岩是一套连续的中奥陶世海相地层沉积,为研究斜率超长周期对该时期冰川—海平面变化的驱动机制解释提供了理想的材料。大湾沟和苏巴什沟两个剖面斜率周期的振幅调制记录(图6d,e)显示~30.6 ka斜率旋回的振幅变化具有~1.2 Ma的主要周期。~462.5 Ma大湾沟剖面萨尔干组开始沉积时期,此阶段磁化率值整体偏高,对应了~1.2 Ma斜率周期的振幅增大阶段,恰好与萨尔干组沉积处于海平面上升时期相吻合(图6a,b);随后直到~460.3 Ma时,磁化率值一直呈现降低的趋势,对应了~1.2 Ma斜率周期的振幅减小阶段。~459.9 Ma萨尔干组的磁化率值升高,斜率振幅增大,此时对应海平面上升时期。~1.2 Ma斜率长周期与全球海平面变化具有共同的相位关系,~1.2 Ma斜率长周期的最低值对应了海平面的低位。在~1.2 Ma斜率周期的低值阶段,地轴斜率长期处于较弱的状态,振幅波动较小,季节性反差不大,夏季较为凉爽,冬季较为温和,利于高纬地区冰川逐年积累,最终导致海平面的降低[19,50];相反,当~1.2 Ma斜率周期处于高值阶段时,振幅波动较大,季节性增强,炎热的夏季和寒冷的冬季不利于高纬地区冰川的积累,从而使得海平面升高。综上所述,萨尔干组沉积时期的海平面变化受到了~1.2 Ma超长斜率旋回的控制。

    Figure 6.  Sea⁃level change and obliquity amplitude modulation

  • (1) 塔里木盆地苏巴什沟剖面地层记录了完整的米兰科维奇信号,其中包括405 ka长偏心率、100 ka短偏心率、30.6~31.2 ka斜率以及20.0~21.8 ka岁差旋回。

    (2) 利用405 ka长偏心率周期进行天文年代校准,建立了苏巴什沟剖面萨尔干组的天文年代标尺,以Nemagraptus gracilis笔石带的首现层位作为等时界面,将大湾沟剖面和苏巴什沟剖面萨尔干组在405 ka长偏心率时间尺度上进行了高精度对比,证明了中—晚奥陶世时期萨尔干组的沉积模式为海侵模式。

    (3) 中奥陶世海平面变化或受控于~1.2 Ma超长斜率旋回。

Reference (50)

Catalog

    /

    DownLoad:  Full-Size Img  PowerPoint
    Return
    Return