Advanced Search
Volume 43 Issue 3
Jun.  2025
Turn off MathJax
Article Contents

PENG Chenyang, TANG Mingming, HONG Ruifeng, XIONG Sichen. Numerical Simulation of Tidal Delta Sedimentation Based on Sedimentary Dynamics[J]. Acta Sedimentologica Sinica, 2025, 43(3): 846-859. doi: 10.14027/j.issn.1000-0550.2024.081
Citation: PENG Chenyang, TANG Mingming, HONG Ruifeng, XIONG Sichen. Numerical Simulation of Tidal Delta Sedimentation Based on Sedimentary Dynamics[J]. Acta Sedimentologica Sinica, 2025, 43(3): 846-859. doi: 10.14027/j.issn.1000-0550.2024.081

Numerical Simulation of Tidal Delta Sedimentation Based on Sedimentary Dynamics

doi: 10.14027/j.issn.1000-0550.2024.081
Funds:

National Natural Science Foundation of China 42072163

National Natural Science Foundation of China 41972250

  • Received Date: 2024-04-15
  • Accepted Date: 2024-07-24
  • Rev Recd Date: 2024-06-17
  • Available Online: 2024-07-24
  • Publish Date: 2025-06-10
  • Objective Delta is not only an important part of sedimentological research, but also an important oil-gas enrichment layer in oil and gas exploration. The formation and development of deltas are completed by two or three sedimentary processes in rivers, tides, and waves simultaneously. With further research, tidal-controlled deltas have gradually become important targets for oil and gas exploration and sedimentary studies. However, owing to the influence of hydrodynamics, the distribution patterns of sediment bodies in tidal-controlled deltas are unclear, the sedimentary facies combinations are diverse, and the sedimentary systems and characteristics are complex, leading to significant differences in understanding the sedimentary characteristics and deposition models of tidal-controlled deltas. For the study of tidal-controlled deltas, traditional methods often lack field exposures, face difficulty in sedimentary dissections, and have low resolution logging interpretation data, resulting in a certain degree of bias in the understanding of tidal-controlled deltas. The application of numerical simulation method for sediment deposition is expected to solve the above problems. Methods To address these issues, sediment numerical simulation methods (Delft3D) were used to establish an idealized tidal-controlled delta model. By varying the conditions of river flow and tidal amplitudes, the study explored the evolutionary patterns and main control factors of tidal-controlled deltas. Although the hydrodynamic equation model used by Delft3D is smaller in simulation speed and spatiotemporal scale, it can more accurately describe the deposition process and meet the needs of simulation. This simulation model refers to tide-controlled deltas such as Ganges River Delta, which is used as the reference condition of sedimentary environment to determine the main parameters of the model. After the preliminary test and simulation of the parameters, the parameters were reasonably estimated, and the basic model and the corresponding set of parameter system were established, completing the model establishment. Furthermore, to explore the influence of the two variables of river discharge and tide on the development of the tide-controlled delta, the two variables of river discharge and tide amplitude were appropriately enlarged and reduced, and the dam body morphology and delta evolution law were observed by comparison and analysis with the basic simulation. Results The research results show that rivers and tides play different roles in the formation of tidal-controlled deltas. Rivers transport sediment from the upstream, which accumulates at the estuary, while tides transport and deposit sediment from the upstream towards the deep sea, forming sand bars. As the tidal amplitude increases, the bar body develops into a "flattened shape" towards the ocean. The morphology of the bar body and the area of the delta are determined by the river flow and tidal amplitudes. When the river flow and tidal amplitudes increase, their sediment-carrying capacity strengthens, allowing sediment to deposit further from the estuary, increasing the sand bar area. With the increase in tidal amplitudes, the existing bar bodies are eroded and remodeled, transporting the sand bodies towards the ocean, and increasing the average length of the bar body. Conclusions The evolution of tidal-controlled deltas can be divided into three periods: sediment accumulation at the river mouth; transportation of sediment by river-tidal interactions, forming bar bodies, and rapid delta development; and modification of bar bodies by river-tidal interactions, continued growth of delta area, but with a decreasing growth rate.
  • [1] Galloway W E, Hobday D K. Terrigenous clastic depositional systems: Applications to fossil fuel and groundwater resources[M]. 2nd ed. New York: Springer, 1996: 91-125.
    [2] Dalrymple R W, Baker E K, Harris P T, et al. Sedimentology and stratigraphy of a tide-dominated, foreland-basin delta (Fly River, Papua New Guinea) [M]//Sidi F H, Nummedal D, Imbert P, et al. Tropical deltas of southeast Asia⁃Sedimentology, stratigraphy, and petroleum geology. Tulsa: SEPM Special Publication, 2003: 147-173.
    [3] Perignon M, Adams J, Overeem I, et al. Dominant process zones in a mixed fluvial-tidal delta are morphologically distinct[J]. Earth Surface Dynamics, 2020, 8(3): 809-824.
    [4] 牛文蕾. 潮控三角洲分汊河道形成过程和机制的地层记录研究:以长江口北港为例[D]. 上海:华东师范大学,2022:3-33.

    Niu Wenlei. Stratigraphic records of the formation processes and mechanisms of distributary channels in tide-dominated river deltas: A case study in the North Channel, Yangtze River mouth[D]. Shanghai: East China Normal University, 2022: 3-33.
    [5] Li C X, Chen Q Q, Zhang J Q, et al. Stratigraphy and paleoenvironmental changes in the Yangtze Delta during the Late Quaternary[J]. Journal of Asian Earth Sciences, 2000, 18(4): 453-469.
    [6] Wang F, Nian X M, Wang J L, et al. Multiple dating approaches applied to the recent sediments in the Yangtze River (Changjiang) subaqueous delta[J]. The Holocene, 2018, 28(6): 858-866.
    [7] Gugliotta M, Saito Y, Nguyen V L, et al. Tide- and river-generated mud pebbles from the fluvial to marine transition zone of the Mekong River delta, Vietnam[J]. Journal of Sedimentary Research, 2018, 88(9): 981-990.
    [8] Gugliotta M, Saito Y, Nguyen V L, et al. Sediment distribution and depositional processes along the fluvial to marine transition zone of the Mekong River delta, Vietnam[J]. Sedimentology, 2019, 66(1): 146-164.
    [9] Gugliotta M, Saito Y, Nguyen V L, et al. Process regime, salinity, morphological, and sedimentary trends along the fluvial to marine transition zone of the mixed-energy Mekong River delta, Vietnam[J]. Continental Shelf Research, 2017, 147: 7-26.
    [10] Goodbred Jr S L, Kuehl S A. The significance of large sediment supply, active tectonism, and eustasy on margin sequence deve-lopment: Late Quaternary stratigraphy and evolution of the Ganges-Brahmaputra delta[J]. Sedimentary Geology, 2000, 133(3/4): 227-248.
    [11] Braat L, Van Kessel T, Leuven J R F W, et al. Effects of mud supply on large-scale estuary morphology and development over centuries to millennia[J]. Earth Surface Dynamics, 2017, 5(4): 617-652.
    [12] Taylor T R, Kittridge M G, Winefield P, et al. Reservoir quality and rock properties modeling-Triassic and Jurassic sandstones, greater Shearwater area, UK Central North Sea[J]. Marine and Petroleum Geology, 2015, 65: 1-21.
    [13] van de Lageweg W I, Feldman H. Process-based modelling of morphodynamics and bar architecture in confined basins with fluvial and tidal currents[J]. Marine Geology, 2018, 398: 35-47.
    [14] 刘雪萍, 卢双舫, 唐明明, 等. 河流—潮汐耦合控制下河口湾坝体沉积动力学数值模拟[J]. 地球科学, 2020, 46(8): 2944-2957.

    Liu Xueping, Lu Shuangfang, Tang Mingming, et al. Numerical simulation of sedimentary dynamics to estuarine bar under the coupled fluvial-tidal control[J]. Earth Science, 2020, 46(8): 2944-2957.
    [15] Tang M M, Zhang K X, Huang J X, et al. Facies and the architecture of estuarine tidal bar in the Lower Cretaceous mcmurray Formation, central Athabasca oil sands, Alberta, Canada[J]. Energies, 2019, 12(9): 1769.
    [16] 冯文杰,吴胜和,张可,等. 曲流河浅水三角洲沉积过程与沉积模式探讨:沉积过程数值模拟与现代沉积分析的启示[J]. 地质学报,2017,91(9):2047-2064.

    Feng Wenjie, Wu Shenghe, Zhang Ke, et al. Depositional process and sedimentary model of meandering-river shallow delta: Insights from numerical simulation and modern deposition[J]. Acta Geologica Sinica, 2017, 91(9): 2047-2064.
    [17] 林承焰,陈柄屹,任丽华,等. 沉积数值模拟研究现状及实例[J]. 地质学报,2023,97(8):2756-2773.

    Lin Chengyan, Chen Bingyi, Ren Lihua, et al. A review of depositional numerical simulation and a case study[J]. Acta Geologica Sinica, 2023, 97(8): 2756-2773.
    [18] 张夏林,吴冲龙,周琦,等. 贵州超大型锰矿集区的多尺度三维地质建模[J]. 地球科学,2020,45(2):634-644.

    Zhang Xialin, Wu Chonglong, Zhou Qi, et al. Multi-scale 3D modeling and visualization of super large manganese ore gathering area in Guizhou China[J]. Earth Science, 2020, 45(2): 634-644.
    [19] Sloss L L. Stratigraphic models in exploration[J]. AAPG Bulletin, 1962, 46(7): 1050-1057.
    [20] Schwarzacher W. Sedimentation in subsiding basins[J]. Nature, 1966, 210(5043): 1349-1350.
    [21] Caldwell R L. The effect of grain size on river delta process and morphology[D]. Boston: Boston College, 2013: 9-40.
    [22] 王杨君,尹太举,邓智浩,等. 水动力数值模拟的河控三角洲分支河道演化研究[J]. 地质科技情报,2016,35(1):44-52.

    Wang Yangjun, Yin Taiju, Deng Zhihao, et al. Terminal distributary channels in fluvial-dominated delta systems from numerical simulation of hydrodynamics[J]. Geological Science and Technology Information, 2016, 35(1): 44-52.
    [23] Schuurman F, Kleinhans M G. Bar dynamics and bifurcation evolution in a modelled braided sand-bed river[J]. Earth Surface Processes and Landforms, 2015, 40(10): 1318-1333.
    [24] 张可,吴胜和,冯文杰,等. 砂质辫状河心滩坝的发育演化过程探讨:沉积数值模拟与现代沉积分析启示[J]. 沉积学报,2018,36(1):81-91.

    Zhang Ke, Wu Shenghe, Feng Wenjie, et al. Discussion on evolution of bar in sandy braided river: Insights from sediment numerical simulation and modern bar[J]. Acta Sedimentologica Sinica, 2018, 36(1): 81-91.
    [25] Schuurman F, Marra W A, Kleinhans M G. Physics-based modeling of large braided sand-bed rivers: Bar pattern formation, dynamics, and sensitivity[J]. Journal of Geophysical Research: Earth Surface, 2013, 118(4): 2509-2527.
    [26] Granjeon D, Joseph P. Concepts and applications of a 3-D multiple lithology, diffusive model in stratigraphic modeling [M]. Tulsa: SEPM Special Publication, 1999: 197-210.
    [27] Burgess P M. A brief review of developments in stratigraphic forward modelling, 2000-2009[M]//Roberts D G, Bally A W. Regional geology and tectonics: Principles of geologic analysis. Boston: Elsevier, 2012: 378-404.
    [28] Lesser G R, Roelvink J A, Van Kester J A T M, et al. Development and validation of a three-dimensional morphological model[J]. Coastal Engineering, 2004, 51(8/9): 883-915.
    [29] Nardin W, Fagherazzi S. The effect of wind waves on the development of river mouth bars[J]. Geophysical Research Letters, 2012, 39(12): L12607.
    [30] Carballo R, Iglesias G, Castro A. Numerical model evaluation of tidal stream energy resources in the Ría de Muros (NW Spain)[J]. Renewable Energy, 2009, 34(6): 1517-1524.
    [31] Griffiths C M, Dyt C, Paraschivoiu E, et al. SEDSIM in hydrocarbon exploration[M]//Merriam D F, Davis J C. Geologic modeling and simulation. Boston: Springer, 2001: 71-97.
    [32] Granjeon D, Joseph P. Concepts and applications of a 3-D multiple lithology, diffusive model in stratigraphic modeling[M]//Harbaugh J W, Watney W L, Rankey E C, et al. Numerical experiments in stratigraphy: Recent advances in stratigraphic and sedimentologic computer simulations. Tulsa: SEPM Special Publication, 1999: 197-210.
    [33] Zheng X Y, Mayerle R, Wang Y B, et al. Study of the wind drag coefficient during the storm Xaver in the German Bight using data assimilation[J]. Dynamics of Atmospheres and Oceans, 2018, 83: 64-74.
    [34] 刘雪萍. 基于沉积动力学方法的潮控河口湾储层沉积模式研究[D]. 青岛:中国石油大学(华东),2021:22-24.

    Liu Xueping. Study on sedimentary model of tide-dominated estuary reservoir based on sedimentary dynamics[D]. Qingdao: China University of Petroleum (East China), 2021: 22-24.
    [35] Van Der Vegt H, Storms J E A, Walstra D J R, et al. Can bed load transport drive varying depositional behaviour in river delta environments?[J]. Sedimentary Geology, 2016, 345: 19-32.
    [36] van Rijn L C. Estuarine and coastal sedimentation problems[J]. International Journal of Sediment Research, 2005, 20(1): 39-51.
    [37] Xu Z H, Plink-Björklund P. Quantifying formative processes in river- and tide-dominated deltas for accurate prediction of future change[J]. Geophysical Research Letters, 2023, 50(20): 1-12.
    [38] Nienhuis J H, Hoitink A J F, Törnqvist T E. Future change to tide-influenced deltas[J]. Geophysical Research Letters, 2018, 45(8): 3499-3507.
  • 加载中
通讯作者: 陈斌, bchen63@163.com
  • 1. 

    沈阳化工大学材料科学与工程学院 沈阳 110142

  1. 本站搜索
  2. 百度学术搜索
  3. 万方数据库搜索
  4. CNKI搜索

Figures(8)  / Tables(4)

Article Metrics

Article views(401) PDF downloads(69) Cited by()

Proportional views
Related
Publishing history
  • Received:  2024-04-15
  • Revised:  2024-06-17
  • Accepted:  2024-07-24
  • Published:  2025-06-10

Numerical Simulation of Tidal Delta Sedimentation Based on Sedimentary Dynamics

doi: 10.14027/j.issn.1000-0550.2024.081
Funds:

National Natural Science Foundation of China 42072163

National Natural Science Foundation of China 41972250

Abstract: Objective Delta is not only an important part of sedimentological research, but also an important oil-gas enrichment layer in oil and gas exploration. The formation and development of deltas are completed by two or three sedimentary processes in rivers, tides, and waves simultaneously. With further research, tidal-controlled deltas have gradually become important targets for oil and gas exploration and sedimentary studies. However, owing to the influence of hydrodynamics, the distribution patterns of sediment bodies in tidal-controlled deltas are unclear, the sedimentary facies combinations are diverse, and the sedimentary systems and characteristics are complex, leading to significant differences in understanding the sedimentary characteristics and deposition models of tidal-controlled deltas. For the study of tidal-controlled deltas, traditional methods often lack field exposures, face difficulty in sedimentary dissections, and have low resolution logging interpretation data, resulting in a certain degree of bias in the understanding of tidal-controlled deltas. The application of numerical simulation method for sediment deposition is expected to solve the above problems. Methods To address these issues, sediment numerical simulation methods (Delft3D) were used to establish an idealized tidal-controlled delta model. By varying the conditions of river flow and tidal amplitudes, the study explored the evolutionary patterns and main control factors of tidal-controlled deltas. Although the hydrodynamic equation model used by Delft3D is smaller in simulation speed and spatiotemporal scale, it can more accurately describe the deposition process and meet the needs of simulation. This simulation model refers to tide-controlled deltas such as Ganges River Delta, which is used as the reference condition of sedimentary environment to determine the main parameters of the model. After the preliminary test and simulation of the parameters, the parameters were reasonably estimated, and the basic model and the corresponding set of parameter system were established, completing the model establishment. Furthermore, to explore the influence of the two variables of river discharge and tide on the development of the tide-controlled delta, the two variables of river discharge and tide amplitude were appropriately enlarged and reduced, and the dam body morphology and delta evolution law were observed by comparison and analysis with the basic simulation. Results The research results show that rivers and tides play different roles in the formation of tidal-controlled deltas. Rivers transport sediment from the upstream, which accumulates at the estuary, while tides transport and deposit sediment from the upstream towards the deep sea, forming sand bars. As the tidal amplitude increases, the bar body develops into a "flattened shape" towards the ocean. The morphology of the bar body and the area of the delta are determined by the river flow and tidal amplitudes. When the river flow and tidal amplitudes increase, their sediment-carrying capacity strengthens, allowing sediment to deposit further from the estuary, increasing the sand bar area. With the increase in tidal amplitudes, the existing bar bodies are eroded and remodeled, transporting the sand bodies towards the ocean, and increasing the average length of the bar body. Conclusions The evolution of tidal-controlled deltas can be divided into three periods: sediment accumulation at the river mouth; transportation of sediment by river-tidal interactions, forming bar bodies, and rapid delta development; and modification of bar bodies by river-tidal interactions, continued growth of delta area, but with a decreasing growth rate.

PENG Chenyang, TANG Mingming, HONG Ruifeng, XIONG Sichen. Numerical Simulation of Tidal Delta Sedimentation Based on Sedimentary Dynamics[J]. Acta Sedimentologica Sinica, 2025, 43(3): 846-859. doi: 10.14027/j.issn.1000-0550.2024.081
Citation: PENG Chenyang, TANG Mingming, HONG Ruifeng, XIONG Sichen. Numerical Simulation of Tidal Delta Sedimentation Based on Sedimentary Dynamics[J]. Acta Sedimentologica Sinica, 2025, 43(3): 846-859. doi: 10.14027/j.issn.1000-0550.2024.081
  • 三角洲是河流在一个稳定的蓄水体中形成的、部分露出水面、分布于河口地区的沉积体。三角洲的形成和发育主要受河流以及海洋能量的相对强度所控制。Galloway[1]根据沉积物注入、波浪能量与潮汐能量三种作用的相对关系,建立了三角洲三端元分类方案,将三角洲分为河控三角洲、浪控三角洲以及潮控三角洲三类。其中潮控三角洲是河流搬运的沉积物,受潮汐作用影响,向河口前方改造,形成线性状潮汐砂坝。潮控三角洲的研究主要集中在现存的弗莱河三角洲[2]、恒河三角洲[3]、长江三角洲[46]、湄公河三角洲[79]等地区。潮控三角洲一般形成于进积和搬运时期,其主要发育在中—大潮差的狭窄地区,潮汐作用为主要作用,大于波浪作用和河流作用,由上游来的沉积物只能在港湾内堆积,形成小型三角洲。在潮汐作用的改造下,三角洲常发育裂指状散射且断续分布的潮汐砂坝。随着河流作用变小,潮汐作用变大,其改造作用使得沉积物向前方改造,坡度一般小于河控三角洲[10]。潮控三角洲的发育与演化,主要由河流与潮汐控制。当潮汐幅度变小、河流流量增大时,河道泥质填充,河口变窄,发育形成潮控三角洲[11],当河流流量与潮汐作用发生变化时,均会对潮控三角洲的坝体发育造成一定程度的影响[1213]。因此,可通过河流流量与潮汐幅度两种主控因素分析潮控三角洲发育及坝体分布的影响,进一步预测储层砂体构型及泥质物质的空间分布情况。

    潮控三角洲的常用研究方法主要有古代沉积记录分析、现代沉积解剖、沉积模拟等[14]。但受潮汐、波浪作用等因素的影响,潮控三角洲井间砂体—隔夹层分布特征研究难度大。由于海陆过渡相存在的野外露头少见,现代沉积解剖难度较大,能提供的内部三维结构信息较少[15],对于潮控三角洲的认识还存在一定的偏差。沉积模拟技术是一种基于泥沙水动力学的沉积学研究技术,可根据拟定条件模拟沉积过程及演化过程[16]。沉积模拟可分为以“水槽实验”为主的沉积物理模拟实验和以“模型方程”为主的数值模拟[17]。沉积物理模拟实验的限制条件较多,模拟尺度较小,实验周期较长,需严格遵守相似性原则[18]。沉积数值模拟可操作性强,适用于各种沉积环境,可在原有的沉积模拟条件的基础上进行参数的修改与调整,更好地定量描述沉积机理与过程,预测砂体分布,解决由于少井、稀井地区资料缺乏导致沉积环境认识不足的问题。

    最早的沉积数值模拟可追溯到20世纪60年代,Sloss[19]通过改变不同条件,建立了不同沉积环境下的沉积概念模型。Schwarzacher [20]在Sloss的基础上,对模型进行改造,建立了碎屑岩和碳酸沉积岩数值模型。随着计算机技术的不断发展,沉积数值模拟精度与准确度不断提高,学者利用该方法对沉积机理与过程有了更详细地描述与解释,很大程度上解决了沉积学与油气勘探中的实际问题[2125]。沉积数值模拟方法根据理论方法可分为扩散方程模型[26]、几何规则模型[27]、模糊逻辑模型、元胞自动机模型以及水动力方程[27]模型五类[28]。基于上述模型,前人也开发出了相应的沉积模拟软件,如Delft3D[2930]、SEDSIM[31]、Dionisos[32]等。然而,基于扩撒方程模型得到的数值模拟结果具有非唯一性,需结合工区进行具体比对;基于几何规则的模型缺乏力学方程的限制约束,其结果的准确性需进一步验证;元胞自动机模型所需数据十分精细,应用范围受限;模糊逻辑模型上手难度较大,需要较强的操作经验。水动力方程模型虽然模拟速度和时空尺度较小,但其更能准确地描述沉积过程,同时本次实验模拟的时空尺度在模型可承受范围之内。因此,本文拟采用基于水动力方程模型作为沉积模拟模型,建立一个理想化的潮控三角洲模型,模拟在河流和潮汐联合作用下坝体的形成过程,研究河流流量和潮汐幅度的变化对坝体及三角洲发育的影响。实验中通过改变河流流量和潮汐幅度的大小,观察潮控三角洲的演变过程和规律。对模拟结果展开讨论,分析不同条件下潮控三角洲的主控因素及沉积过程机理,并总结潮控三角洲演化过程。

  • 本次沉积数值模拟采用的是Delft3D软件,该软件基于纳维—斯托克水动力方程[33],通过预测流场的运动,来描述沉积物颗粒与流体之间的相互作用。包括水动力模块(FLOW)、波浪模块(WAVE)、水质模块(WAQ)、颗粒跟踪模块(PART)、生态模块(ECO)、泥沙输移模块(SED)和动力地貌模块(MOR)七大模块,每个模块都可以单独执行,也可以通过信息文件进行模块之间的信息交换从而使多个模块组合执行[34]。水动力方程模型分为水动力数值模拟与泥沙数值模拟两部分。在悬沙计算中自动考虑了三维水动力过程和非平衡含沙量剖面的适应性,且考虑了悬浮泥沙的密度效应,同时水深变化也可及时反馈至水动力计算中,使得沉积过程能被更准确地描述,模拟结果更符合实际。其水动力数值模拟过程通过水平动量方程、连续性方程以及物质传输搬运方程进行模拟。其中式(1)、(2)为xy方向的水平动量方程,式(3)为连续性方程,式(4)为物质传输搬运方程[27]

    Ut+UUx+vUy+ωhUσ-fV=-1ρ0Px+Fx+Mx+1h2συVUσ (1)
    Vt+UVx+vVy+ωhVσ-fU=-1ρ0Py+Fy+My+1h2συVVσ (2)
    ξt+[hU]x+[hV]y=S (3)
    [hc]t+[hUc]x+[hVc]y+[ωc]σ=hxDHcx+yDHcy+1hσDvcσ+hS (4)

    式(1)~(4)中:UV为在xy方向上的速度(m∕s), f为科里奥利参数(s-1),c为沉积物浓度(kg∕m3),ρ0为水的密度(kg∕m3),P为压强(Pa),F为雷诺水平应力,M为其他外力,h为水深(m),υV为运动黏度(m2∕s),ξ为水面相对于参考深度高程(m),UV为深度平均后xy方向上的速度(m∕s),S为盐度(ng∕L),ωσ坐标系中的垂直速度分量(s-1),DHDV为水平和垂直方向的扩散系数。

    在Delft3D中,可定义多个组分的泥沙,包括其名称、粒径大小、密度、沉降速率、是否具有黏性等[35]。其中泥沙模型整体包括悬移物质和推移物质两部分,两者单独计算,将最终结果相加得到整体泥沙输送量。其计算公式如式(5)所示[36]

    S=Sb+Ss,eq=0.05αq5gC32D50 (5)

    式中:Sb为悬疑物质输送量;Ss,eq推移物质输送量;q为流速大小(m∕s),依据河流流量进行取值,为相对密度,C为摩擦系数,取值为0.05,α为校准系数,取值为1。

  • 在开展沉积数值模拟前,需对模拟参数进行设定,主要包括模型尺寸、物源供应、泥沙物含量、河流流量、潮汐幅度等。同时结合潮控三角洲的沉积特征与井震资料,对参数进行调整与修改,优化模型,提高模型模拟结果的精度与准确度[1523]。最后依据模拟结果,分析潮控三角洲内部砂体结构及分布模式。

  • 本次模拟参考恒河三角洲作为典型潮控三角洲沉积环境的参照条件。潮汐对恒河三角洲的沉积特征产生了深刻的影响,使得其沉积物具有明显的潮汐控制特征。潮汐作用导致了沉积物的分选作用。恒河三角洲的沉积物主要由河流物质和海洋物质组成,而潮汐作用使海洋物质和河流物质在垂向上分离。在高潮位时,海水倒灌到河口区域,带来了丰富的海洋沉积物质,如海洋生物碎屑、贝壳和沙子等,这些物质通常具有较大的粒径和较好的圆度,易于沉积,形成了相对均匀的潮间带沉积物;而在低潮位时,海水退去,河流物质发生沉积。由于河流物质主要由砂、泥、粉砂等细粒物质组成,这些物质的粒径较小,圆度较差,因此沉积物中的颗粒分选程度较高,形成了相对不均匀的河道沉积物。同时,潮汐还会使三角洲的沉积速率和厚度发生变化。在高潮位时,海水倒灌,河口区域水深增加,潮汐能较容易地带来海洋物质并发生沉积;在低潮位时,河口区域水深减小,沉积能力减弱,沉积速率和厚度减缓。由于潮汐对恒河三角洲的沉积物质运移具有重要影响,也使得沉积速率和厚度的变化更加显著。表1为河流的一些主要参数,是本次沉积数值模拟的依据。由于模拟参数具有一定的不确定性,不同模型参数组合不同,对于一个新模型来说,需要在参数估值之后,进行初步测试,取得关于参数分布的认识,为后面的参数优选和模型优化做好准备。其中一些参数可以确定,一些参数暂不能完全确定,但可确定其变化范围。确定性参数包括初始水深环境范围、物源模式、沉降存在和波浪不能取代潮汐,可变参数包括基底初始水深、砂质供应速率、水流量、海平面变化和构造沉降量。在经过参数初步测试和模拟后,进行合理估值,建立基本模型和相应的一套参数体系。

    河流名称参数恒河吉伦特河亚马逊河沉积数值模拟中的指示参数
    潮差平均2.00 m,最高4.93 m平均2.5 m,最高5.0 m小潮差3.5 m,大潮差6.0 m及以上潮汐幅度
    平均流量30 000 m3/s3 000 m3/s4 600~21 700 m3/s河流流量
    含砂量0.02 kg/ m31~10 g/L湿季125 mg/L 干季22 mg/L颗粒含量
    年输沙量703万吨8 359万吨10亿吨物源供给量
    平均水深30 m3~4 m10~30 m初始水深环境

    Table 1.  Main parameters of river flow and their indicative significance

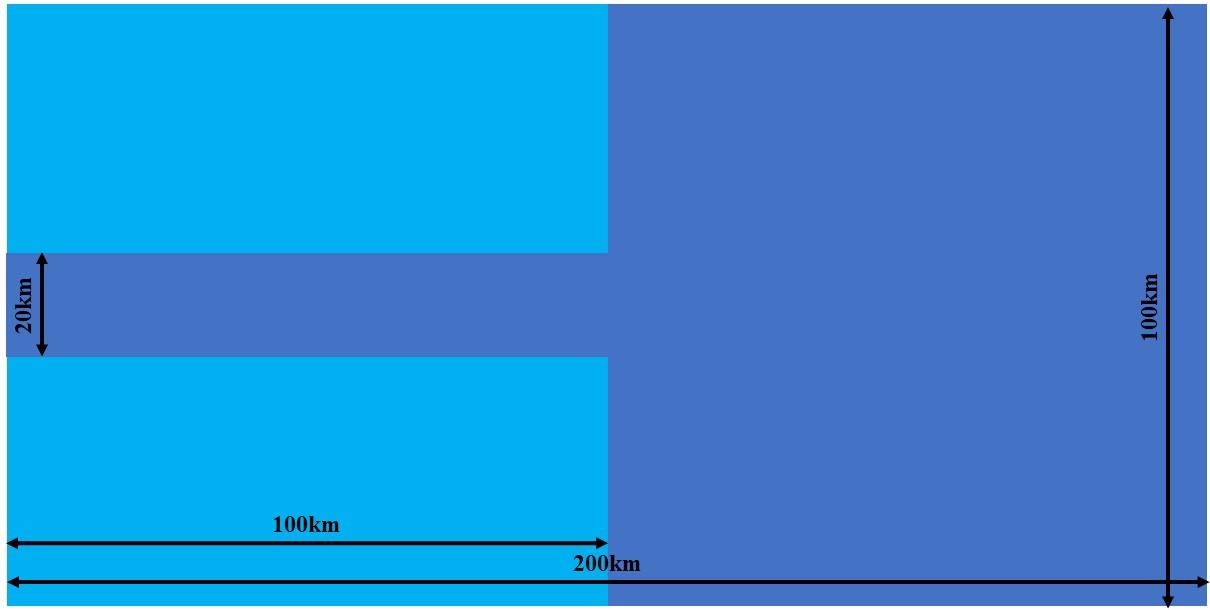
  • 建立一个理想化潮控三角洲模型,从而进一步确定潮控三角洲沉积地貌的主控因素及砂体分布形态与内部三维结构特性。模型如图1所示,本次模拟定义的网格大小为800 m×800 m,垂向网格数为10个,模拟区大小为200 km×100 km,由河流带和海洋区组成。上下边界为封闭边界,左右边界为开放边界,其中左侧为河流带边界,均匀设置4个供水口,每个供水口视为一条河流,每个供水口流量相等。河流长100 km,宽20 km,坡度为0.030°。右侧为海洋边界,海洋面积为20 000 km2。模型定义两种不同粒径的非黏性沉积物以及一种黏性沉积物,其中非黏性沉积物分别代表中—细砂和粉砂,其中中—细砂粒径为160 μm,粉砂粒径为80 μm,黏性沉积物代表泥质物质。本次模拟时间为10年,加速因子20,反映约200年潮控三角洲的沉积过程。形态加速因子并不会对沉积数值模拟得到的结果造成影响[24]。每三个月对模拟结果进行一次输出,记一次为一个step(表3)。为了探究不同河流流量和潮汐能量强度对潮控三角洲坝体形态的影响,针对河流流量与潮汐幅度两个变量进行分析。本次研究选择3个河流流量,分别为5 000 m3∕s、10 000 m3∕s以及15 000 m3∕s,其河流带总流量分别为20 000 m3∕s、40 000 m3∕s以及60 000 m3∕s。潮汐幅度分别设置为0 m、2 m与4 m(表2)。根据上述条件进行两两组合,共得到9组实验模型与结果。

    Figure 1.  Simulation model of tidal delta

    模型参数选值依据参考值变化范围
    确定参数初始水深环境范围现代潮控三角洲1~15 m
    物源模式沉积数值模拟分析东西两侧流入
    沉降控制沉积数值模拟分析发生构造沉降
    可变参数基底初始水深现代潮控三角洲30~50 m
    砂质供应速率沉积数值模拟分析0.5 km3/Ma±25%
    流量现代潮控三角洲、沉积数值模拟与经验值10 000m3/s5 000 ~15 000 m3/s
    海平面变化国际标准、区域层序模式、典型GR曲线变化幅度0~50 m

    Table 2.  Understanding of determining and variable factors

    参数项数值
    模拟时长 (year)10
    工区大小 (km)200×100
    网格大小 (m)800×800
    离散时间步长 (min)3
    潮汐强度 (m)2
    河流流量 (m3/s)40 000
    河流宽度 (km)20
    沉积物粒度 (μm)160/80/mud
    砂泥比中细砂∶极细—细砂∶泥=1∶2∶1
    模拟时长 (year)10
    沉积加速因子20

    Table 3.  Sedimentary numerical simulation parameters

    参数项河流总流量 (m3/s)潮汐强度 (m)
    A-140 0002
    A-240 0004
    A-340 0000
    B-120 0002
    B-220 0004
    B-320 0000
    C-160 0002
    C-260 0004
    C-360 0000

    Table 4.  Experimental design of sedimentary numerical simulation

  • 基于水动力方程的潮控三角洲的沉积动力学模型,通过观察潮控三角洲生长发育过程,对潮控三角洲演化过程与沉积模式有进一步的认识。同时采用单一因素变量的研究方法,对潮控三角洲演化过程与坝体生长规律进行分析,并结合沉积数值模拟中不同条件下的数值模拟结果对砂坝形态及演化过程、搬运模式、河道变迁进行分析比对。

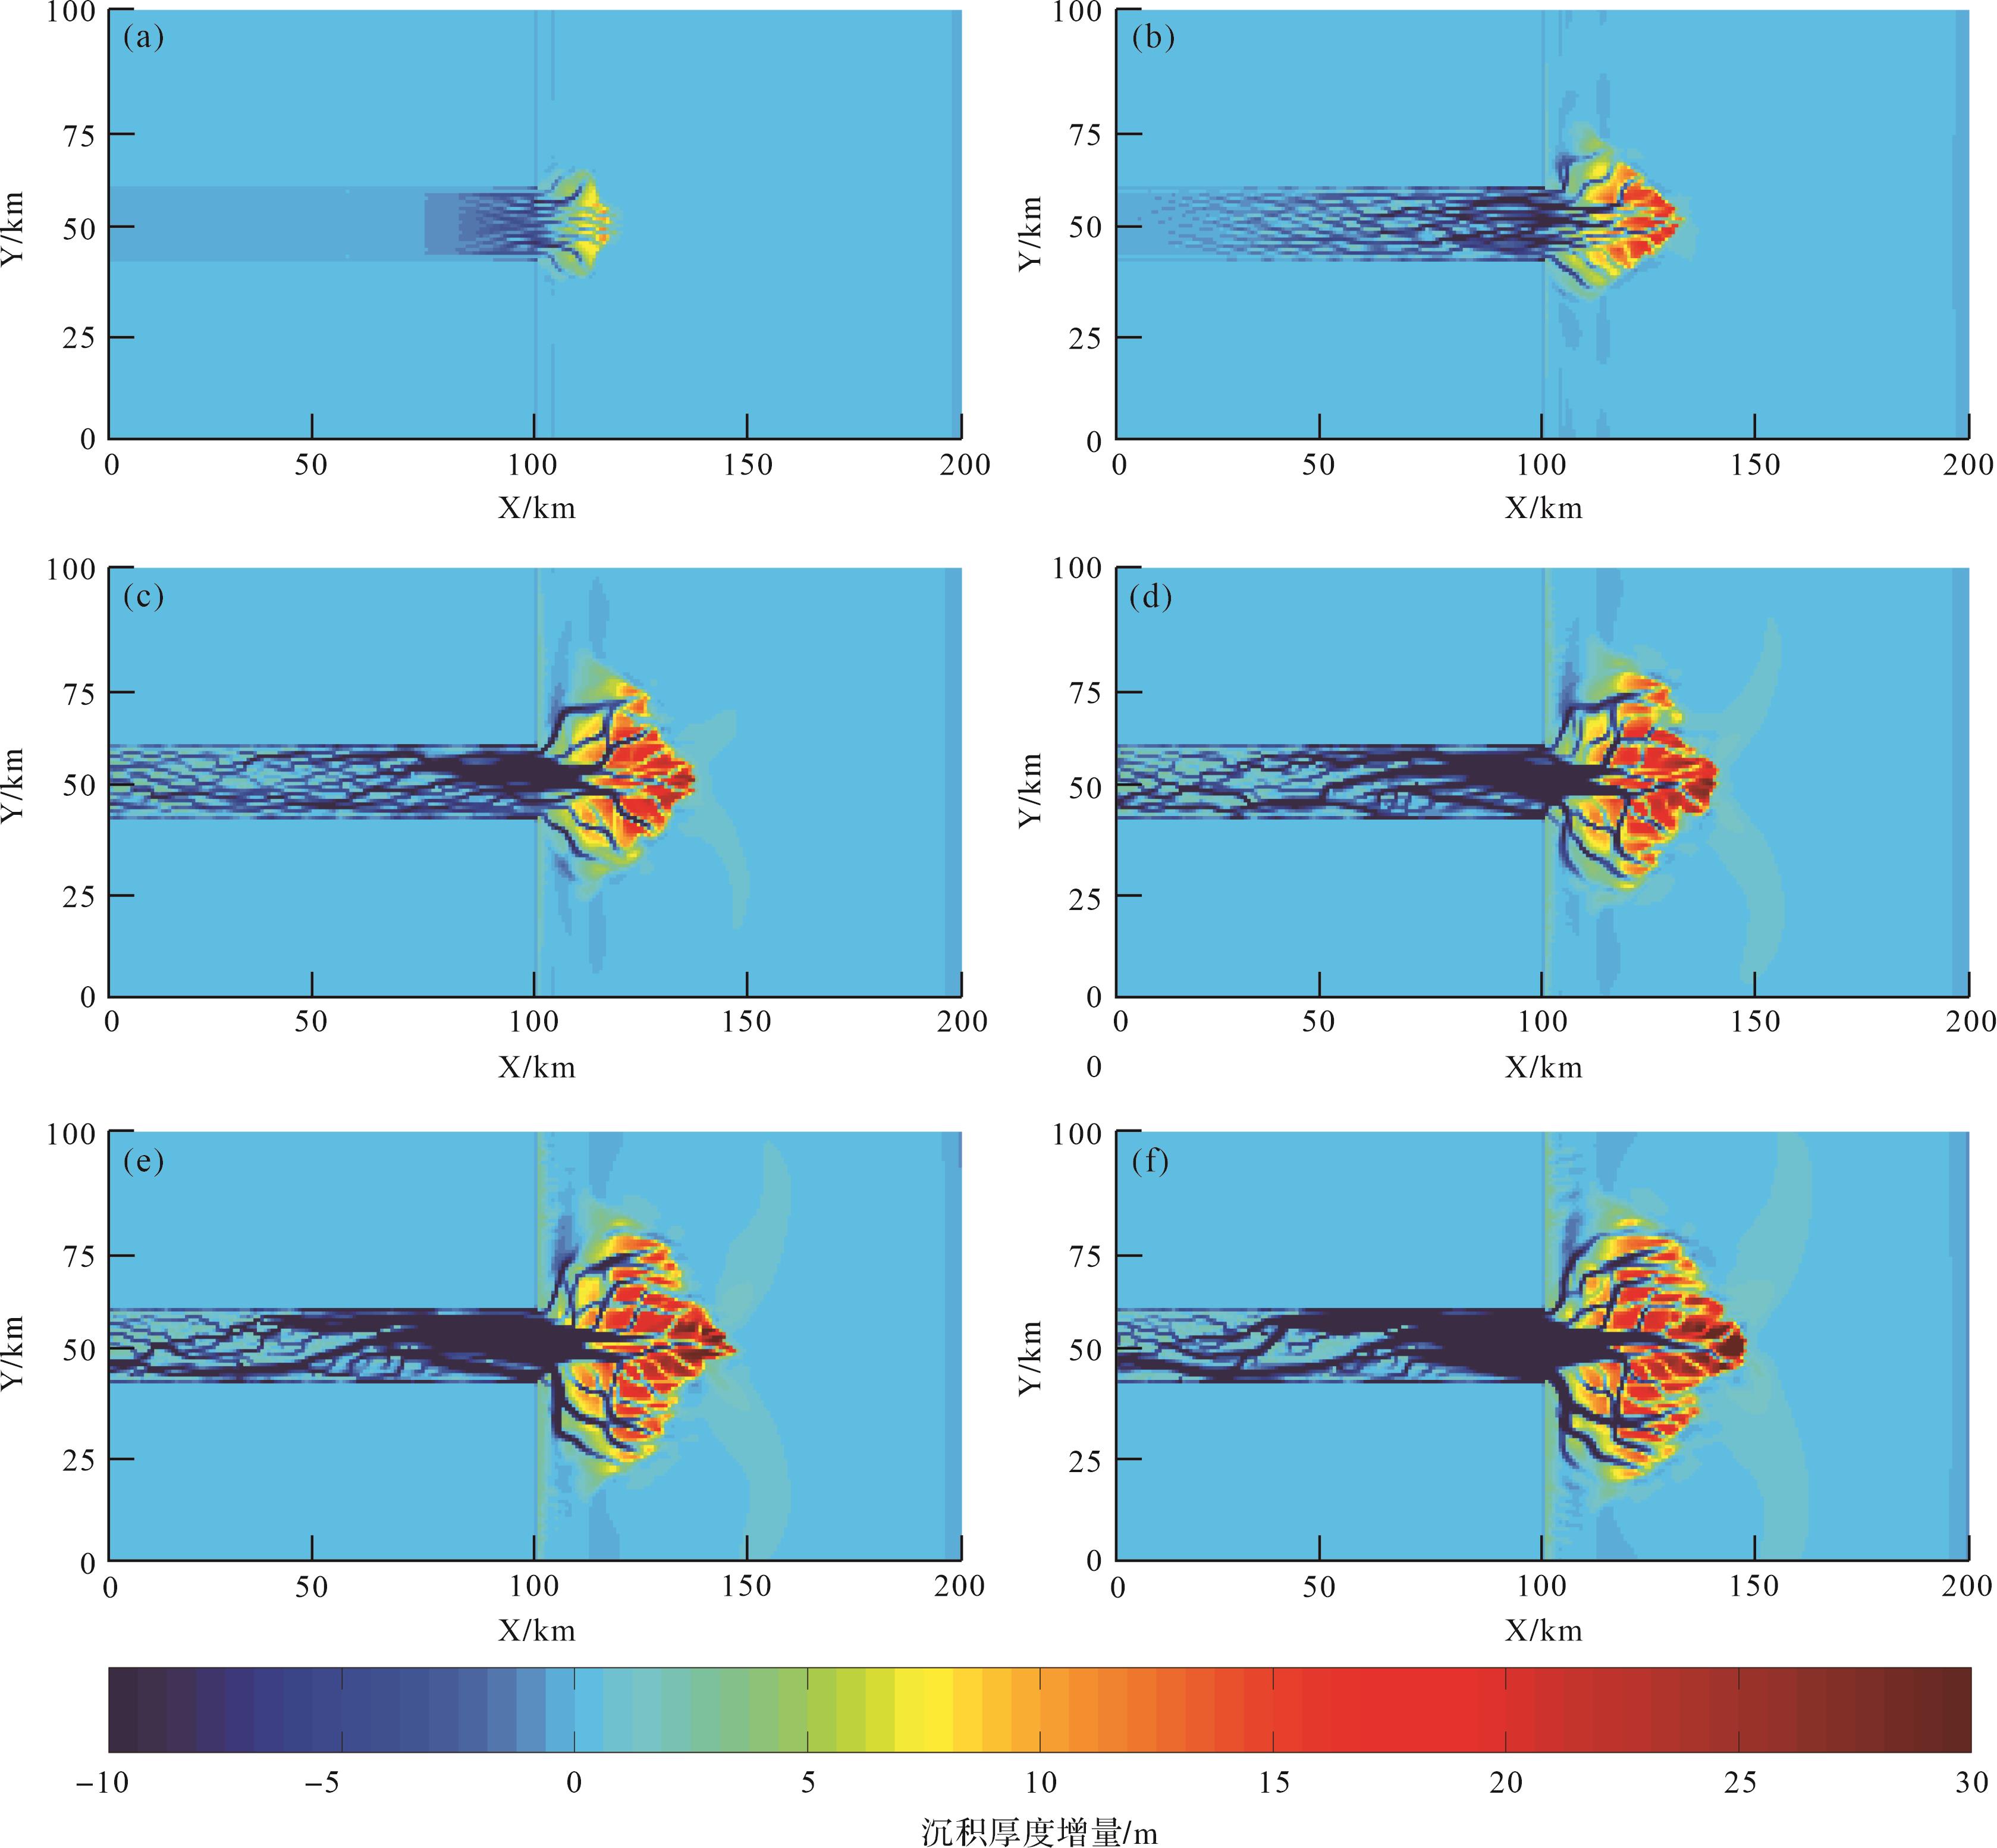
  • 以模拟A-1为例(图2),在三角洲发育早期,来自上游河道的沉积物堆积在河口,在河口快速发育形成河口坝。潮汐将海洋物质搬运至河口形成堆积,同时将来自上游的沉积物向海洋方向搬运,在浅海处形成坝体(图2a)。随着时间的推移,坝体逐渐发育,面积不断增大,供给水道出现分流现象,发生分流的河道其水动力降低,搬运能力减弱,在河道分流处发生沉积物堆积(图2b)。三角洲发育中期,上游河道辫状化,形成心滩,河口处受潮汐作用影响,潮汐侵蚀心滩,将沉积物向海洋方向搬运,堆积在河流分流处,三角洲坝体继续增大,向海洋方向继续延长(图2c,d)。三角洲发育后期,上游河流辫状化作用加深,心滩持续发育。河口处受河流—潮汐联合作用,河流携带沉积物的能力大大增强,将沉积物携带至三角洲。三角洲分叉河开始发育,分叉河对三角洲坝体具有一定的改造作用,在河流分叉处,河流搬运作用减小,部分沉积物堆积在分叉处,逐渐发育成坝体。相比于中期,后期的坝体面积增大,呈扁长状,向深海方向发育,三角洲面积继续增大(图2e,f)。

    Figure 2.  Evolution distribution map of A⁃1 tidal⁃controlled delta deposition thickness

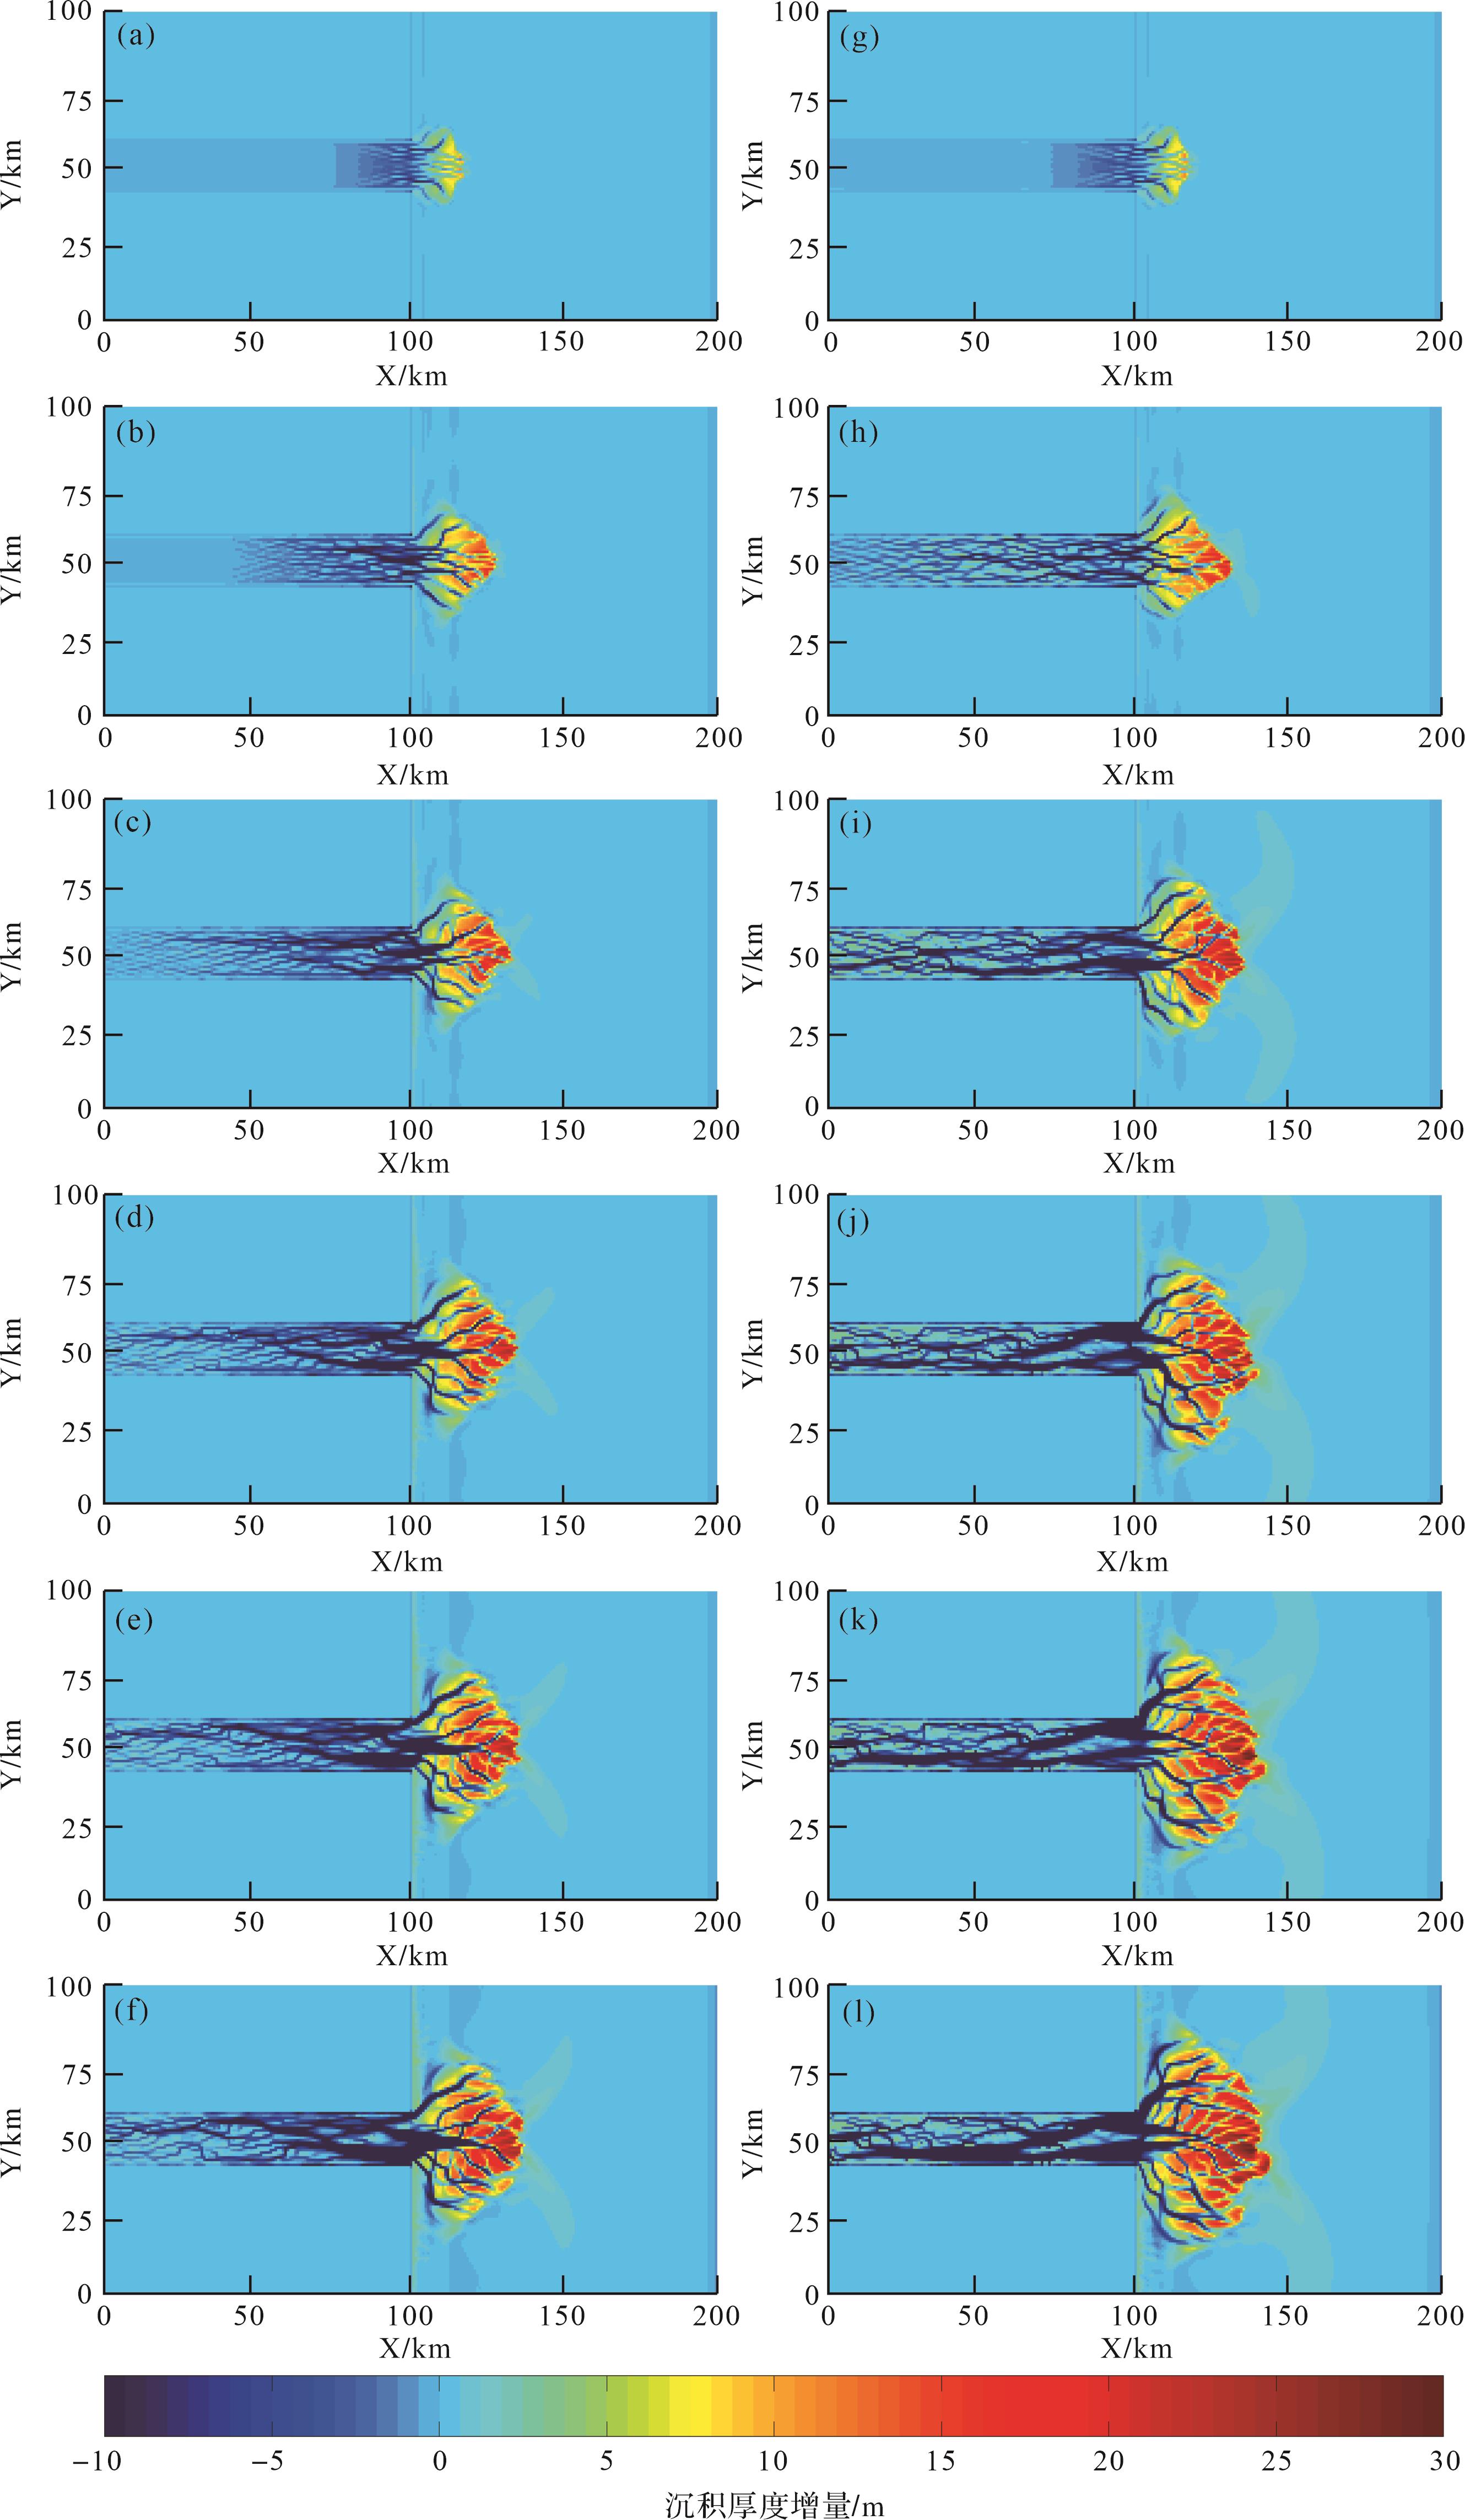
  • 对河流流量进行适当的减少(模拟B-1)和放大(模拟C-1),观察河流对潮控三角洲的影响,实验结果如图3所示。三角洲发育前期,河流流量减少时,上游河流辫状化减少,河流携带沉积物的能力减弱,三角洲坝体数量、长度及厚度均有所减小,分流河道有所加宽(图3a,b);流量增大时,河流携带沉积物的能力增强,上游河流辫状化更加明显,在河口处存在多条河道,上游的沉积物在三角洲发生卸载,因此坝体的面积、厚度增大(图3g,h)。三角洲发育中期,当河流流量减少时,河流段没有明显的辫状化,同时受潮汐作用影响靠近河口的河流段发生侵蚀现象,沉积物搬运至三角洲,三角洲面积相对于模拟A-1有所减小,坝体发育速度减缓(图3c,d);河流流量增加时,河流段有明显的辫状化,伴随心滩生成,河流携带沉积物的能力增加,在河流分叉处有更多的沉积物发生卸载,三角洲整体面积增大,坝体发育速度加快(图3i,j)。三角洲发育后期,当河流流量减少时,河流段的辫状化减弱,在河口处河流—潮汐联合作用区,由于河流搬运沉积物的能力减弱,部分沉积物在河口处发生沉积。同时位于三角洲的河道长度、宽度有所减小,有多条废弃河道,三角洲整体面积减小,坝体数量及面积也比模拟A-1有所减小(图3e,f);河流流量增大时,河流段有更加明显的辫状化,心滩发育更加成熟,在河流—潮汐联合作用区的河口湾,来自上游的部分沉积物被河流—潮汐联合作用携带至三角洲,在河口处发生沉积,形成心滩,河道在心滩处发生分流,河流携带沉积物的能力相对减弱,使得部分沉积物发生卸载,加快了心滩的发育,因此相比于实验B-1河口处的心滩,其面积更大,呈长条形发育,位于三角洲的河道更加发育,三角洲整体面积增大,相比于模拟A-1、模拟B-1,模拟C-1坝体数量、面积有所增加,且多数坝体呈扁长状,向海洋方向发育(图 3k,l)。

    Figure 3.  Evolution distribution map of B⁃1 and C⁃1 tidal⁃controlled delta deposition thickness

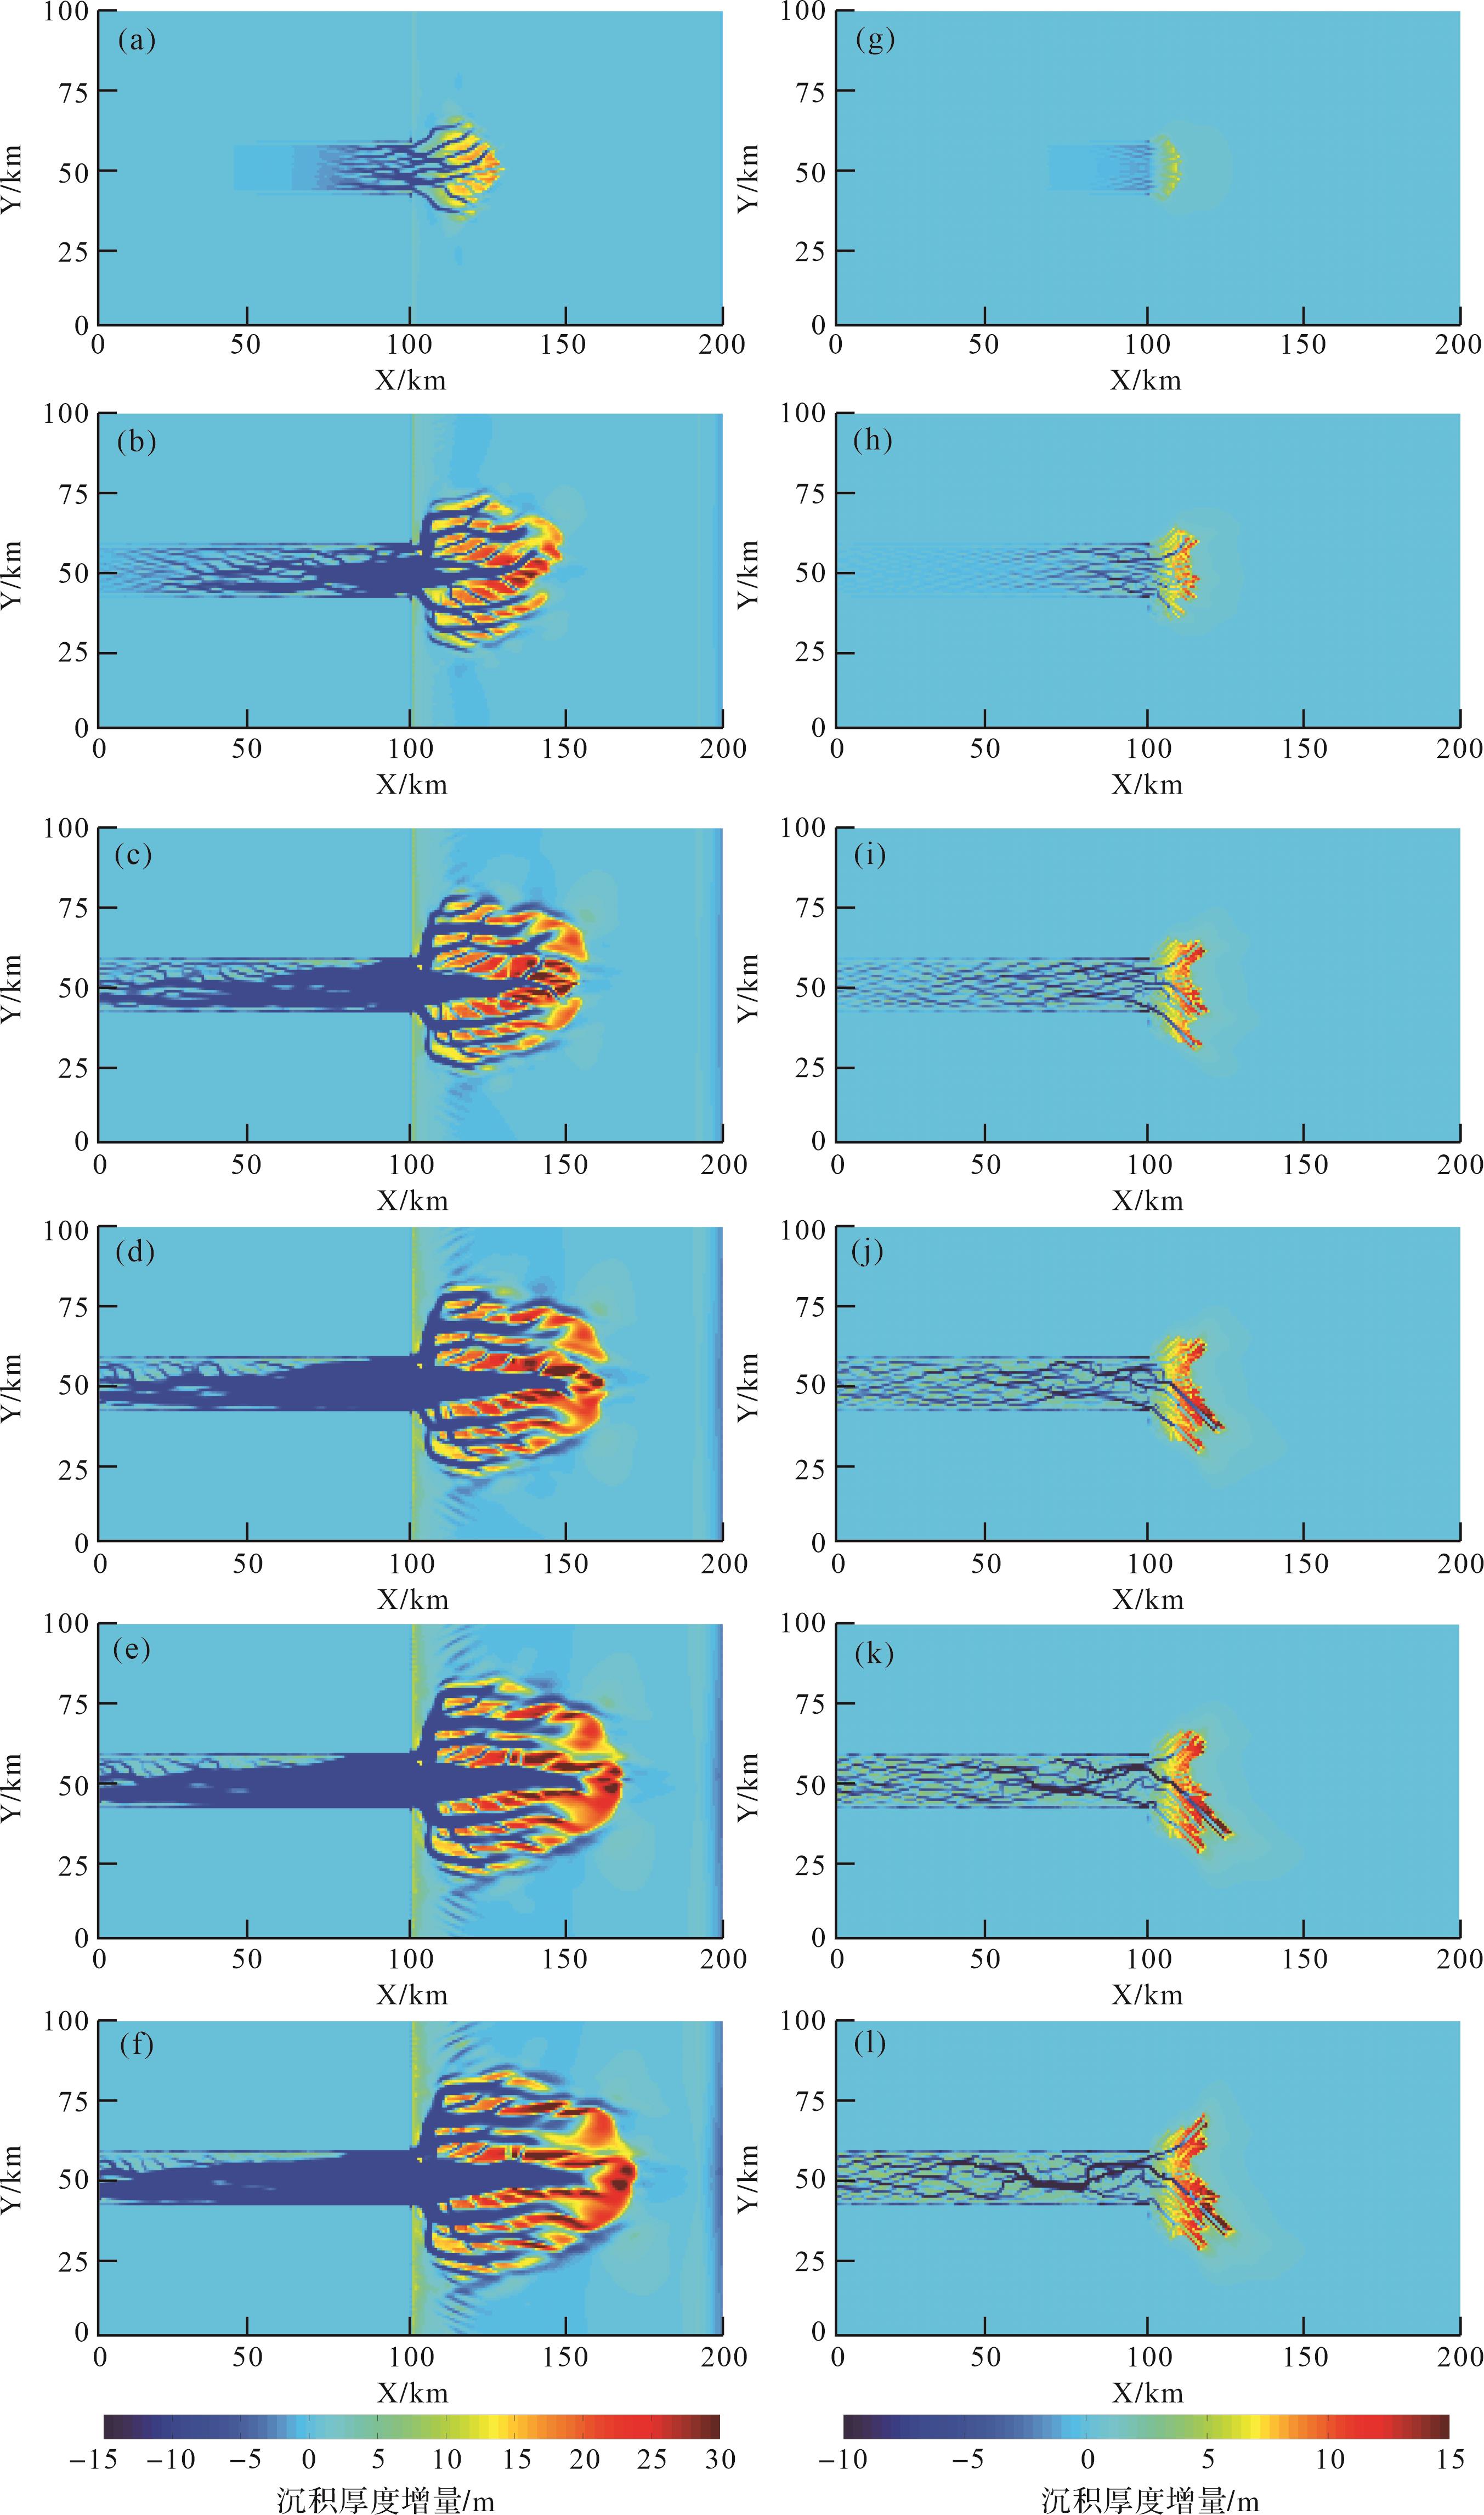
  • 对潮汐幅度进行适当地增大(模拟A-2)和减少(模拟A-3),观察分析潮汐作用对潮控三角洲的影响,实验结果如图 4所示。三角洲发育前期,在没有潮汐作用影响下的三角洲(模拟A-3),只有河流搬运沉积物,搬运能力相对于模拟B-2大幅度减弱,河口处有河道分流现象,河口处形成的河口坝相比于有潮汐作用的条件其面积大大减小,坝体整体发育缓慢,面积较小,呈指状、长条状分布(图4a,b);增大潮汐时(模拟A-2),河道加宽,搬运作用加强,潮汐将河口处更多的砂体搬运至三角洲,三角洲面积相比于模拟A-1明显增大,砂坝数量及面积有所增加,且多数受强潮汐作用影响,呈长条状分布(图 4g,h)。三角洲发育中期,无潮汐条件下河口处河流有明显的辫状化,三角洲发育速度缓慢,分流河道较少,且有废弃河道生成,多数沉积物堆积在废弃河道以及两侧(图 4c,d);潮汐强度增大时,潮汐对河口处的破坏作用增强,将河口处的沉积物搬运至三角洲或远海方向,三角洲发育了明显的主河道,同时形成了多条分流河道,在分流处发育坝体,与模拟A-1相比,模拟A-2的砂体长条状特征更加明显,且数量更多、长度更长,三角洲整体面积更大(图4i,j)。三角洲发育后期,在无潮汐作用条件的情况下,河道经过多期的改造,逐渐有主河道形成,三角洲面积增长速率较低,沉积物多数堆积在河道分流处及入海口,形成坝体(图4e,f);潮汐幅度增大时,潮汐主要对三角洲坝体起改造作用,在携带上游沉积物至三角洲的同时,也对坝体进行一定程度的侵蚀与改造,坝体个数增加,且呈长条状发育,同时部分坝体在强潮汐作用下,逐渐被改造成长条形,沿深海方向发育,三角洲面积增长速率有所减缓,但与同时间段的模拟相比(模拟A-2与A-3),其面积是大幅增加的(图4k,l)。

    Figure 4.  Evolution distribution map of A⁃2 and A⁃3 tidal⁃controlled delta deposition thickness

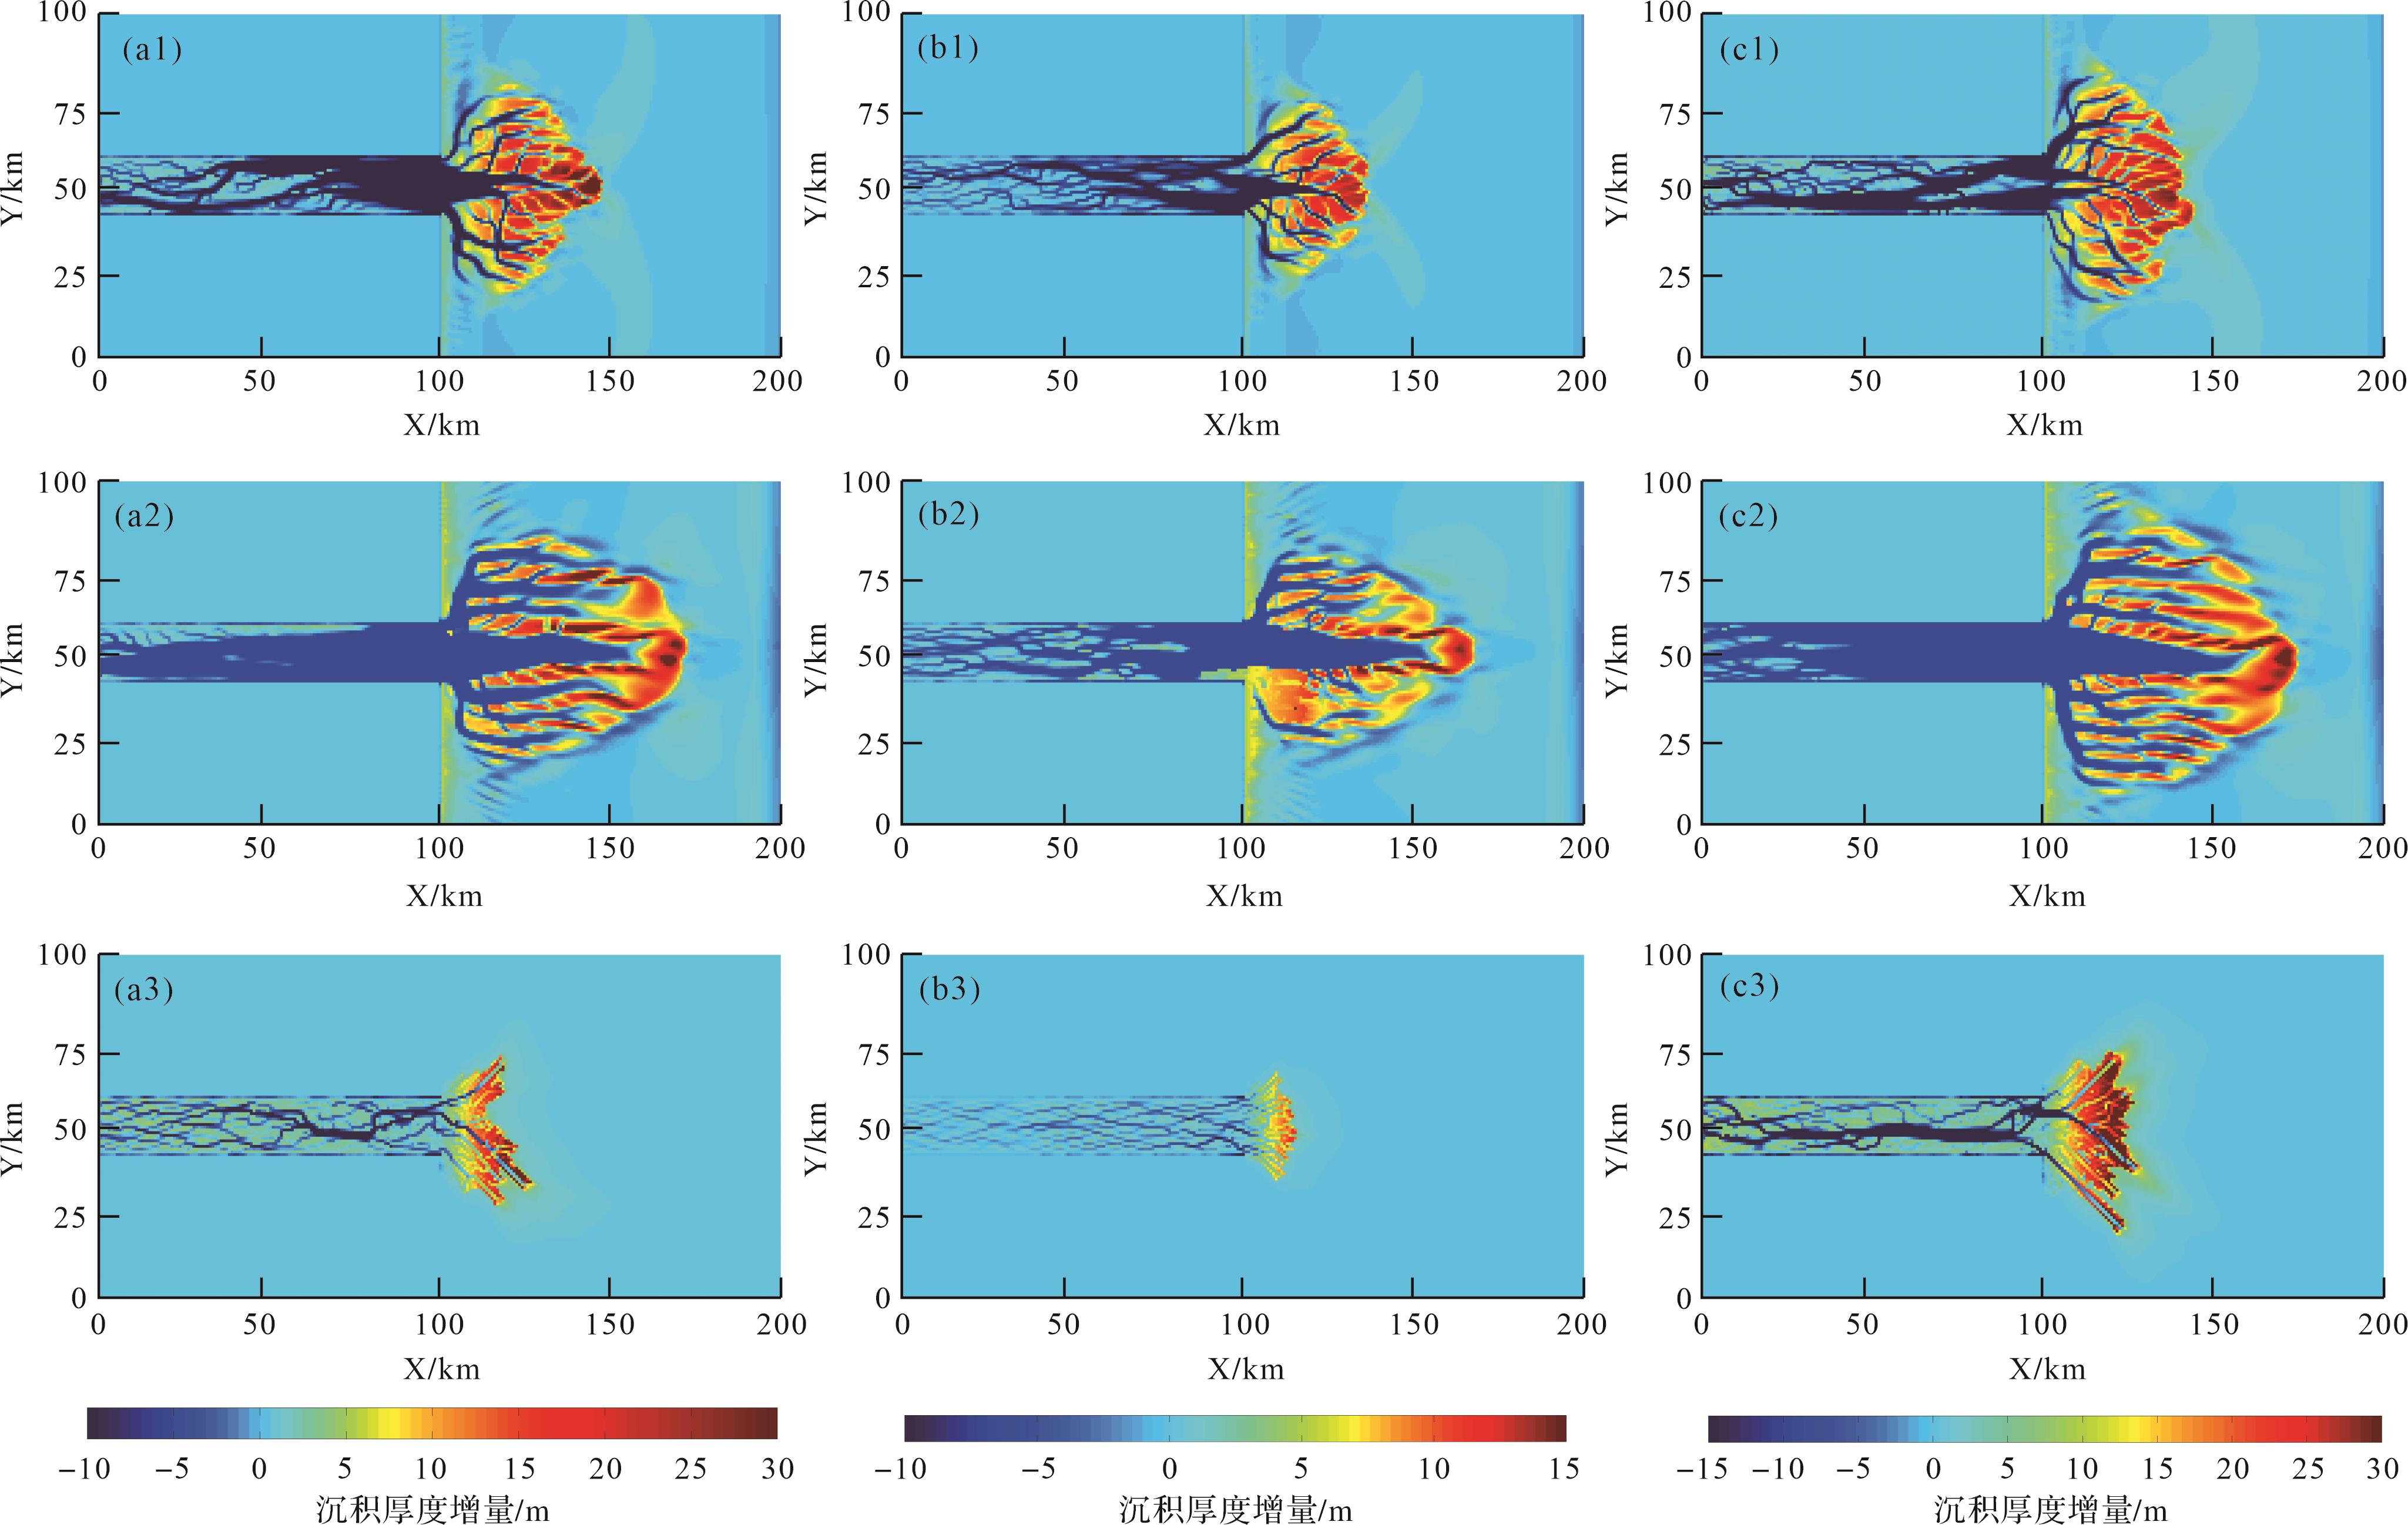
  • 在模拟A-1的基础上,分别将河流流量与潮汐强度进行一定程度的放大与缩小,得到不同河流流量及潮汐强度的潮控三角洲模型。综合对比分析各组模拟结果,发现河流与潮汐在潮控三角洲建设中有着不同的作用,河流在潮控三角洲中的主要作用是将上游沉积物运输至河口处,为河流—潮汐联合作用三角洲提供物源以及提供沉积物运输次要动力。当有潮汐作用时(实验A-1、B-1、C-1),潮汐对三角洲具有破坏和建设作用。潮汐通过侵蚀三角洲,将部分沉积物向海洋方向搬运,沉积物在更远处发生沉积,形成新的坝体,三角洲面积相对于河控三角洲明显增大,坝体在潮汐作用的改造下多数呈长条形分布。潮汐对三角洲坝体进行侵蚀,将部分沉积物搬运至三角洲(图5a1~c1)。随着潮汐幅度的进一步加强(模拟A-2、B-2、C-2),潮汐搬运沉积物的能力变大,对三角洲具有更强的破坏与建设作用。在高潮汐作用的潮控三角洲模型中,潮汐对三角洲具有更强的破坏性,河口处及上游侵蚀作用强烈,在河流—潮汐联合作用下,沉积物向海洋方向搬运,砂体在离河口更远处发生沉积,三角洲面积进一步增大。同时潮汐对坝体具有改造作用,在河流—潮汐联合作用下,坝体主要呈长条形分布,位于各分流河道之间(图 5a2~c2)。在无潮汐的模型中(模拟A-3、B-3、C-3),在没有潮汐作用下,河流携带的沉积物在河口处发生沉积,形成河控三角洲。随着河流流量的增大,河流携带沉积物的能力增强,三角洲的面积及坝体厚度也随之增大(图 5a3~c3)。

    Figure 5.  Tidal delta map under different experimental conditions at the same time (taking step 41 as an example)

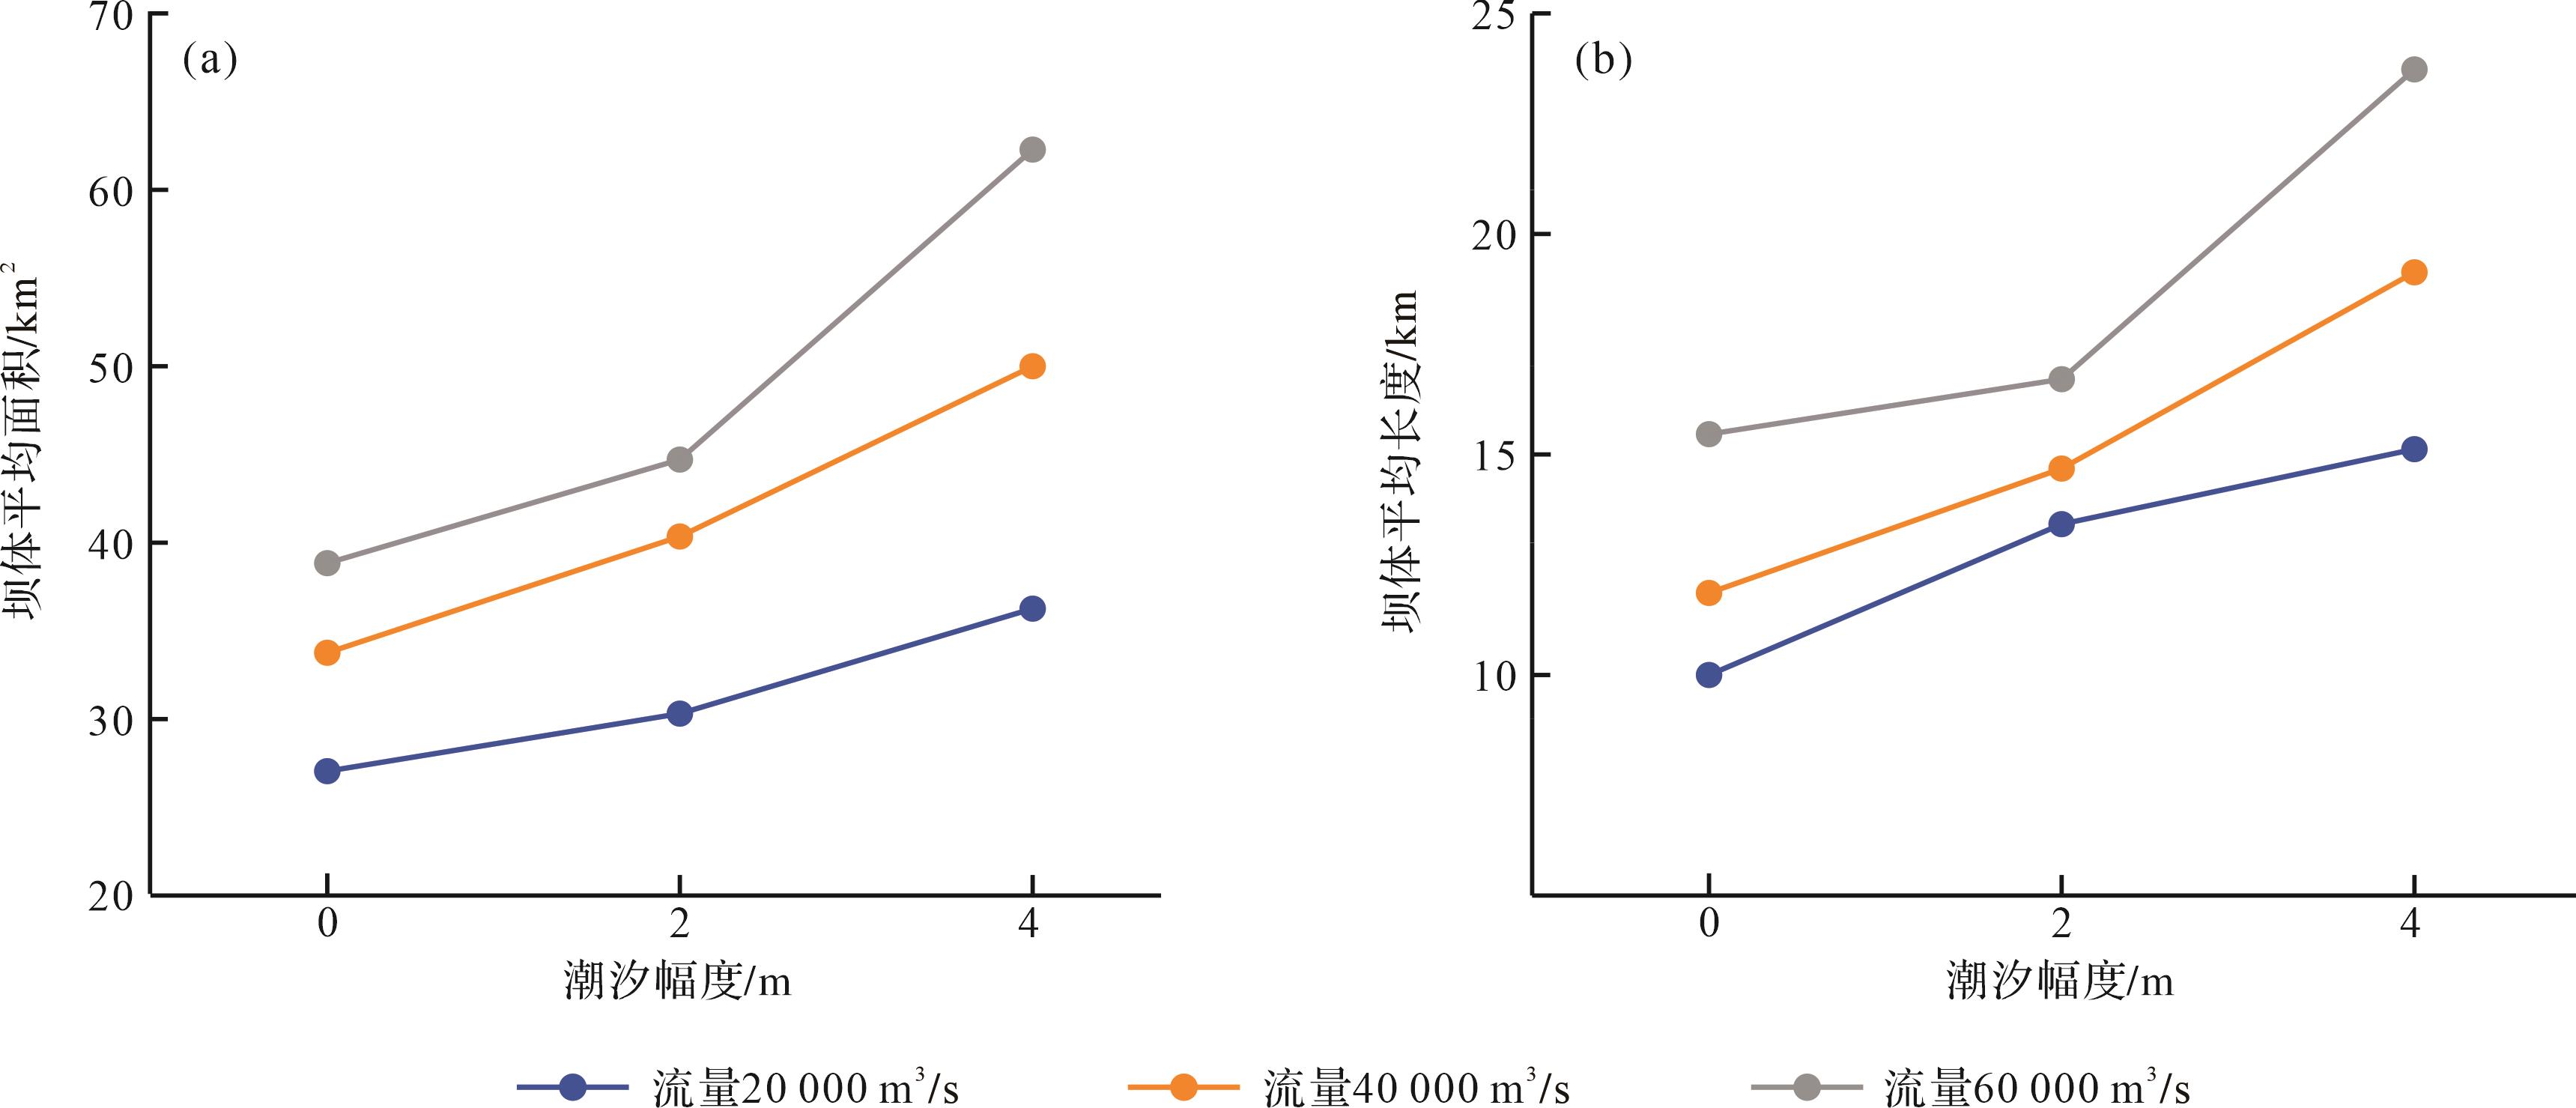
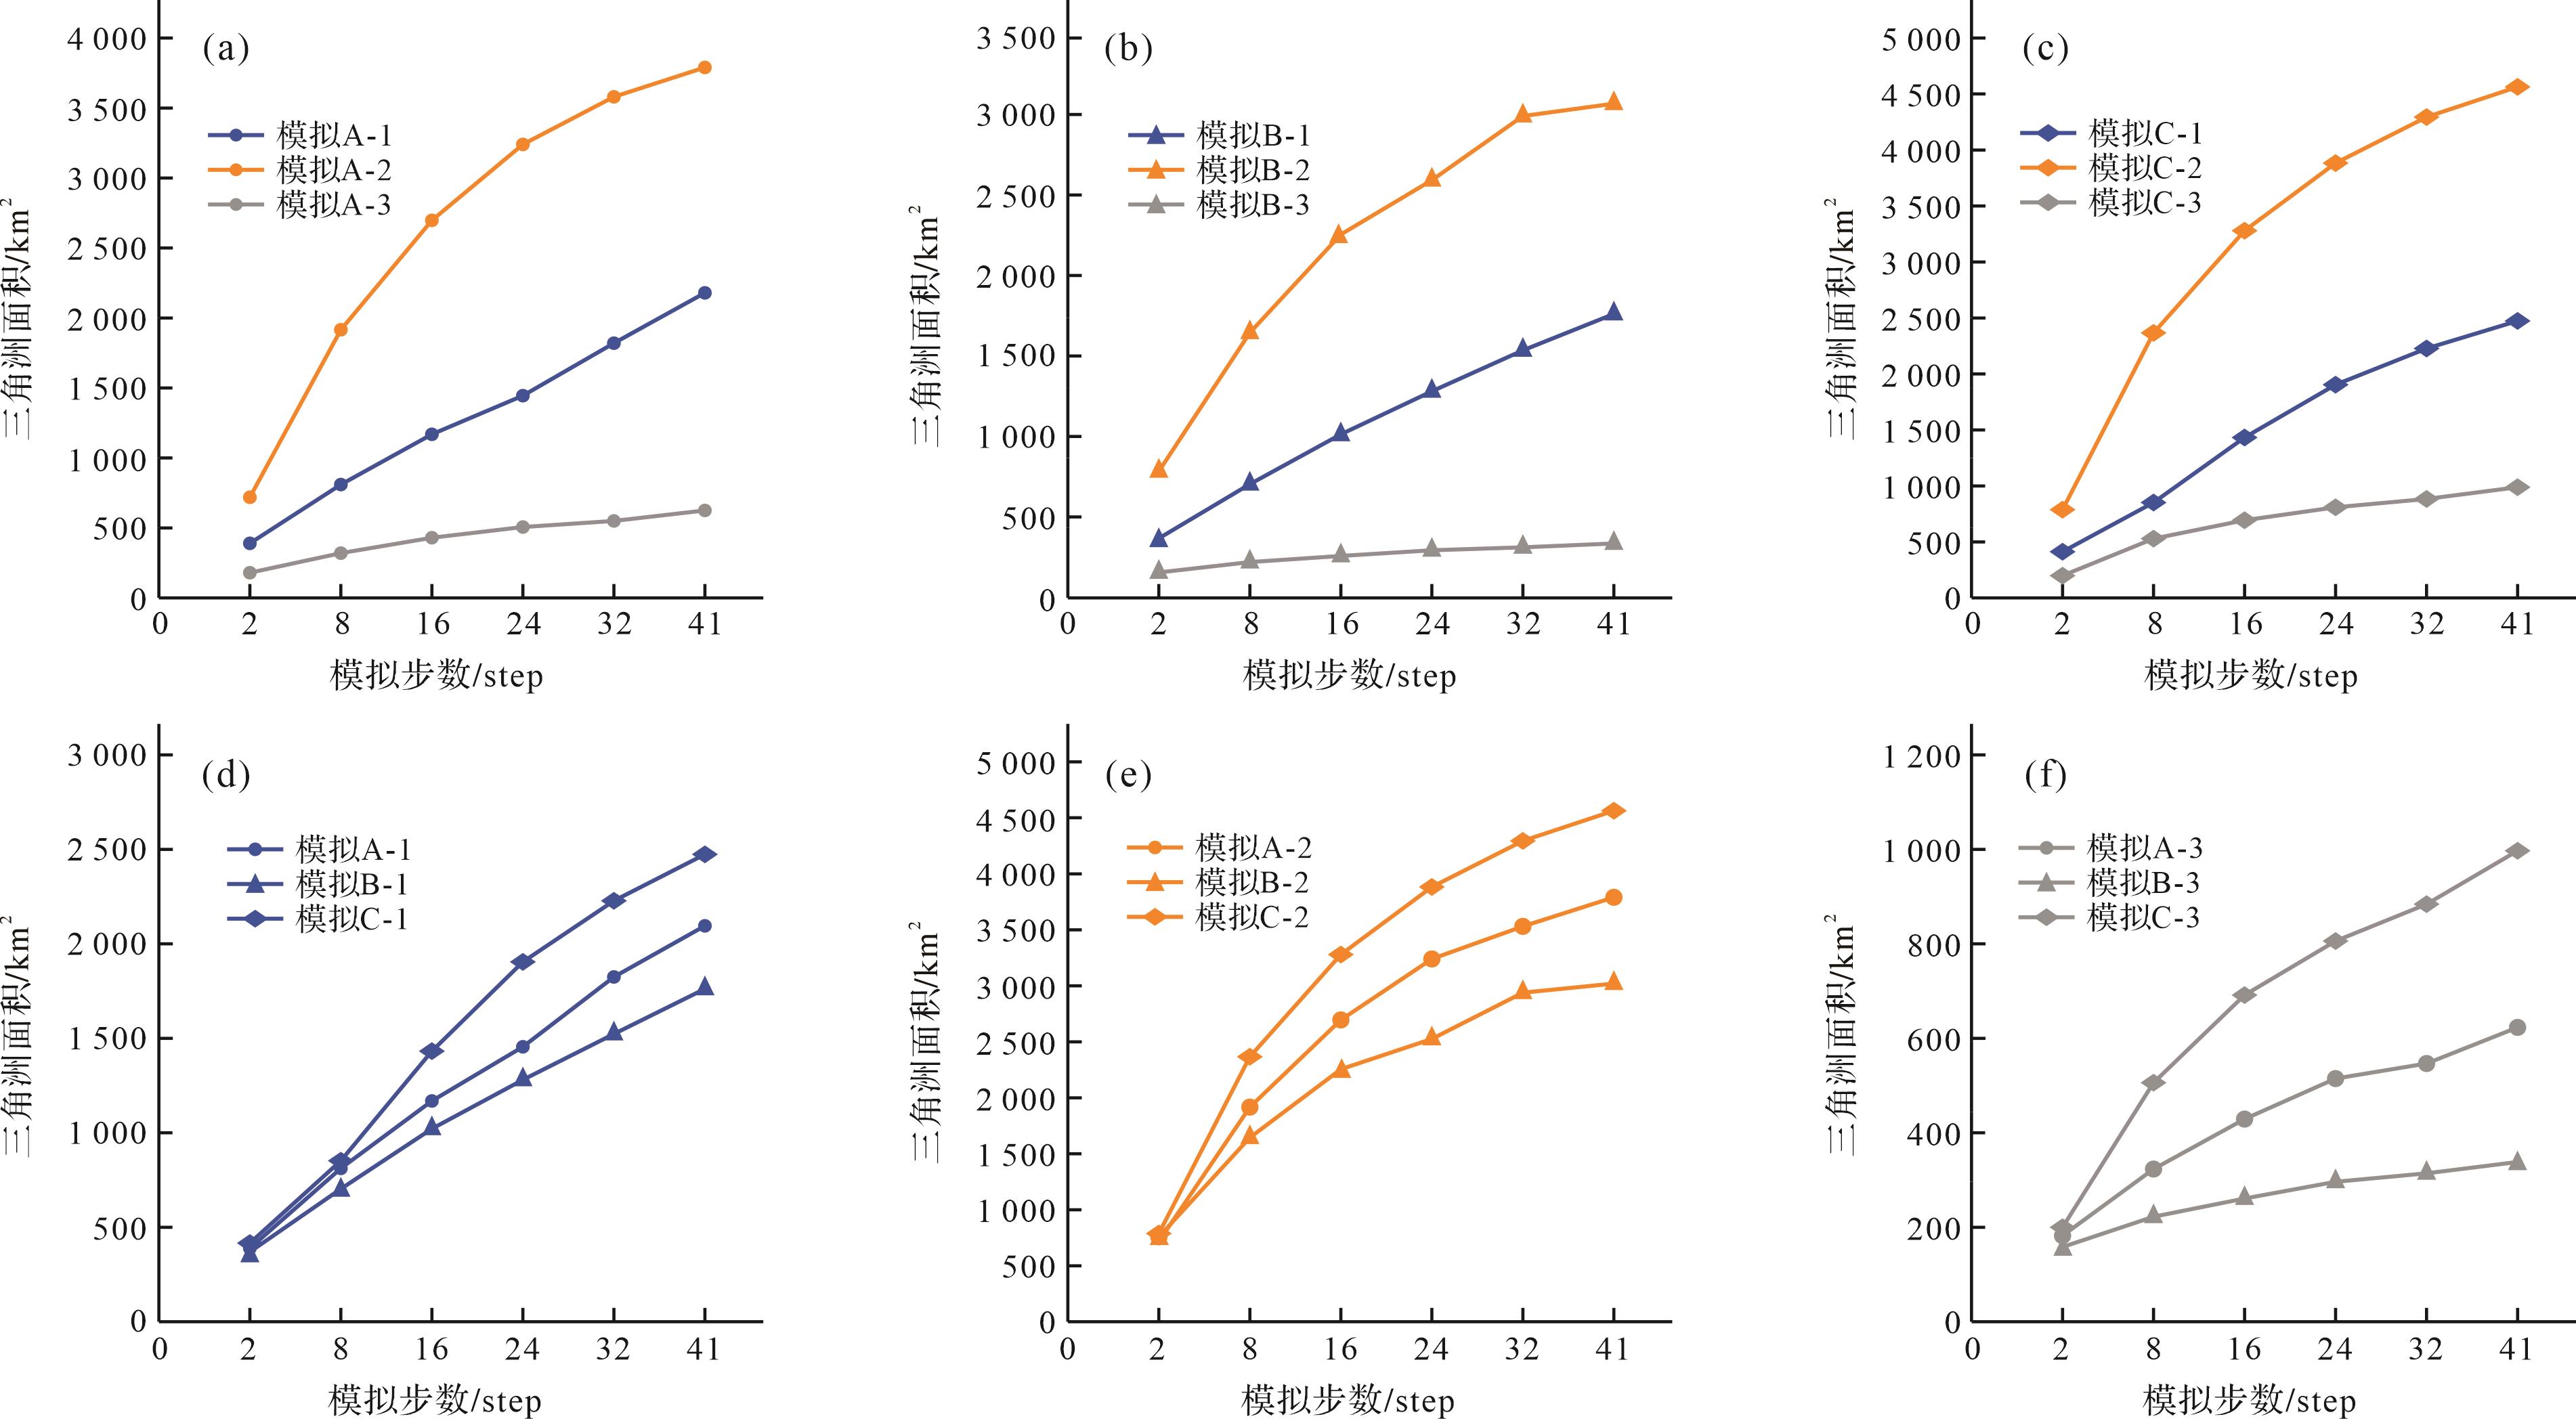
    在此基础上,对不同条件下的砂体形态进行统计。通过相关软件对模拟结果进行处理,统计得到坝体平均面积及平均长度(图6)。结果表明,流量和潮汐均对砂坝形态的变化具有一定的影响。随着河流流量的加大,河流携带沉积物的能力也逐渐增强,携带至入海口的沉积物随之增加,更有利于砂坝的发育。同时潮汐作用将入海口的沉积物向海洋方向搬运,潮汐能量越大,携带沉积物的能力也随之增大,砂坝呈“扁平状”分布,整体向海洋发育。在潮控三角洲坝体的形成与发育中,潮汐比河流提供更多能量,潮汐能量的变化更容易引起砂坝的变化。对各组模拟得到的三角洲面积进行测量统计,依据“同一流量”与“同一潮汐强度”两个条件对测量结果进行整理,其结果(图7)表明:三角洲的面积随时间的变化逐渐增大,潮汐强度决定着三角洲面积变化速率,存在潮汐的模拟,其三角洲增长速率与三角洲面积明显大于无潮汐的模拟,无潮汐模拟下的三角洲发育较缓;增大潮汐强度,在模拟前期三角洲增长速率大大提升,但在模拟中后期增长速率有所减缓,增长速率和未增大潮汐强度前基本保持一致。上述结果说明在河流与潮汐的共同作用下,潮汐对于三角洲的发育建设作用是大于河流的,潮汐强度的改变影响三角洲的生长速率与面积,这一结果与前人所做实验得到的结果相似[3738]。Xu et al.[37]参考弗莱河三角洲建立模型,依据潮汐优势比量化潮控三角洲与河控三角洲,实验结果表明,在潮控三角洲中,砂坝与三角洲的长度和受潮汐影响的河道长度成正比,并随着潮汐强度的增加而增加,并不会随着河流流量的增加而增加。

    Figure 6.  Statistical diagram of average area and average length of sand bars under different conditions

    Figure 7.  Delta area growth map under different conditions

    潮汐在潮控三角洲中的作用是将河口处堆积的沉积物向深海方向继续搬运,对原有坝体进行改造,在一定程度上建设新的三角洲,为三角洲沉积物的搬运提供主要动力。在无潮汐作用下,供给河道直接进入入海口,并在入海口快速形成坝体,随着坝体的快速生长,供给河道发生分流现象,分流后的河道搬运沉积物能力减弱,在分流处发生沉积物的堆积。在潮汐作用下,潮汐对原有坝体进行破坏和改造,向海洋方向搬运沉积物,形成新坝体,因此三角洲面积相比于河控三角洲的面积也有所增大。同时潮汐强度也决定了潮控三角洲的面积,坝体特征也随着河流、潮汐作用的强度而发生变化。坝体面积随着潮汐幅度的增大而增大,且在同等潮汐幅度前提下,坝体平均面积随流量的增大而增大,这是因为流量增大时,河流搬运沉积物的能力增强,搬运至三角洲的沉积物增加,同时潮汐作用也会向河流入侵,形成潮控,加强了河流搬运沉积物的能力。坝体长度也会随着河流、潮汐作用强度的变化而变化。主要原因是潮汐将原有坝体进行侵蚀,将沉积物向远海方向运移,随着河流—潮汐联合作用的强度逐渐减弱,搬运沉积物的能力也随之减弱,逐渐发生沉积,形成砂坝,呈长条状分布。

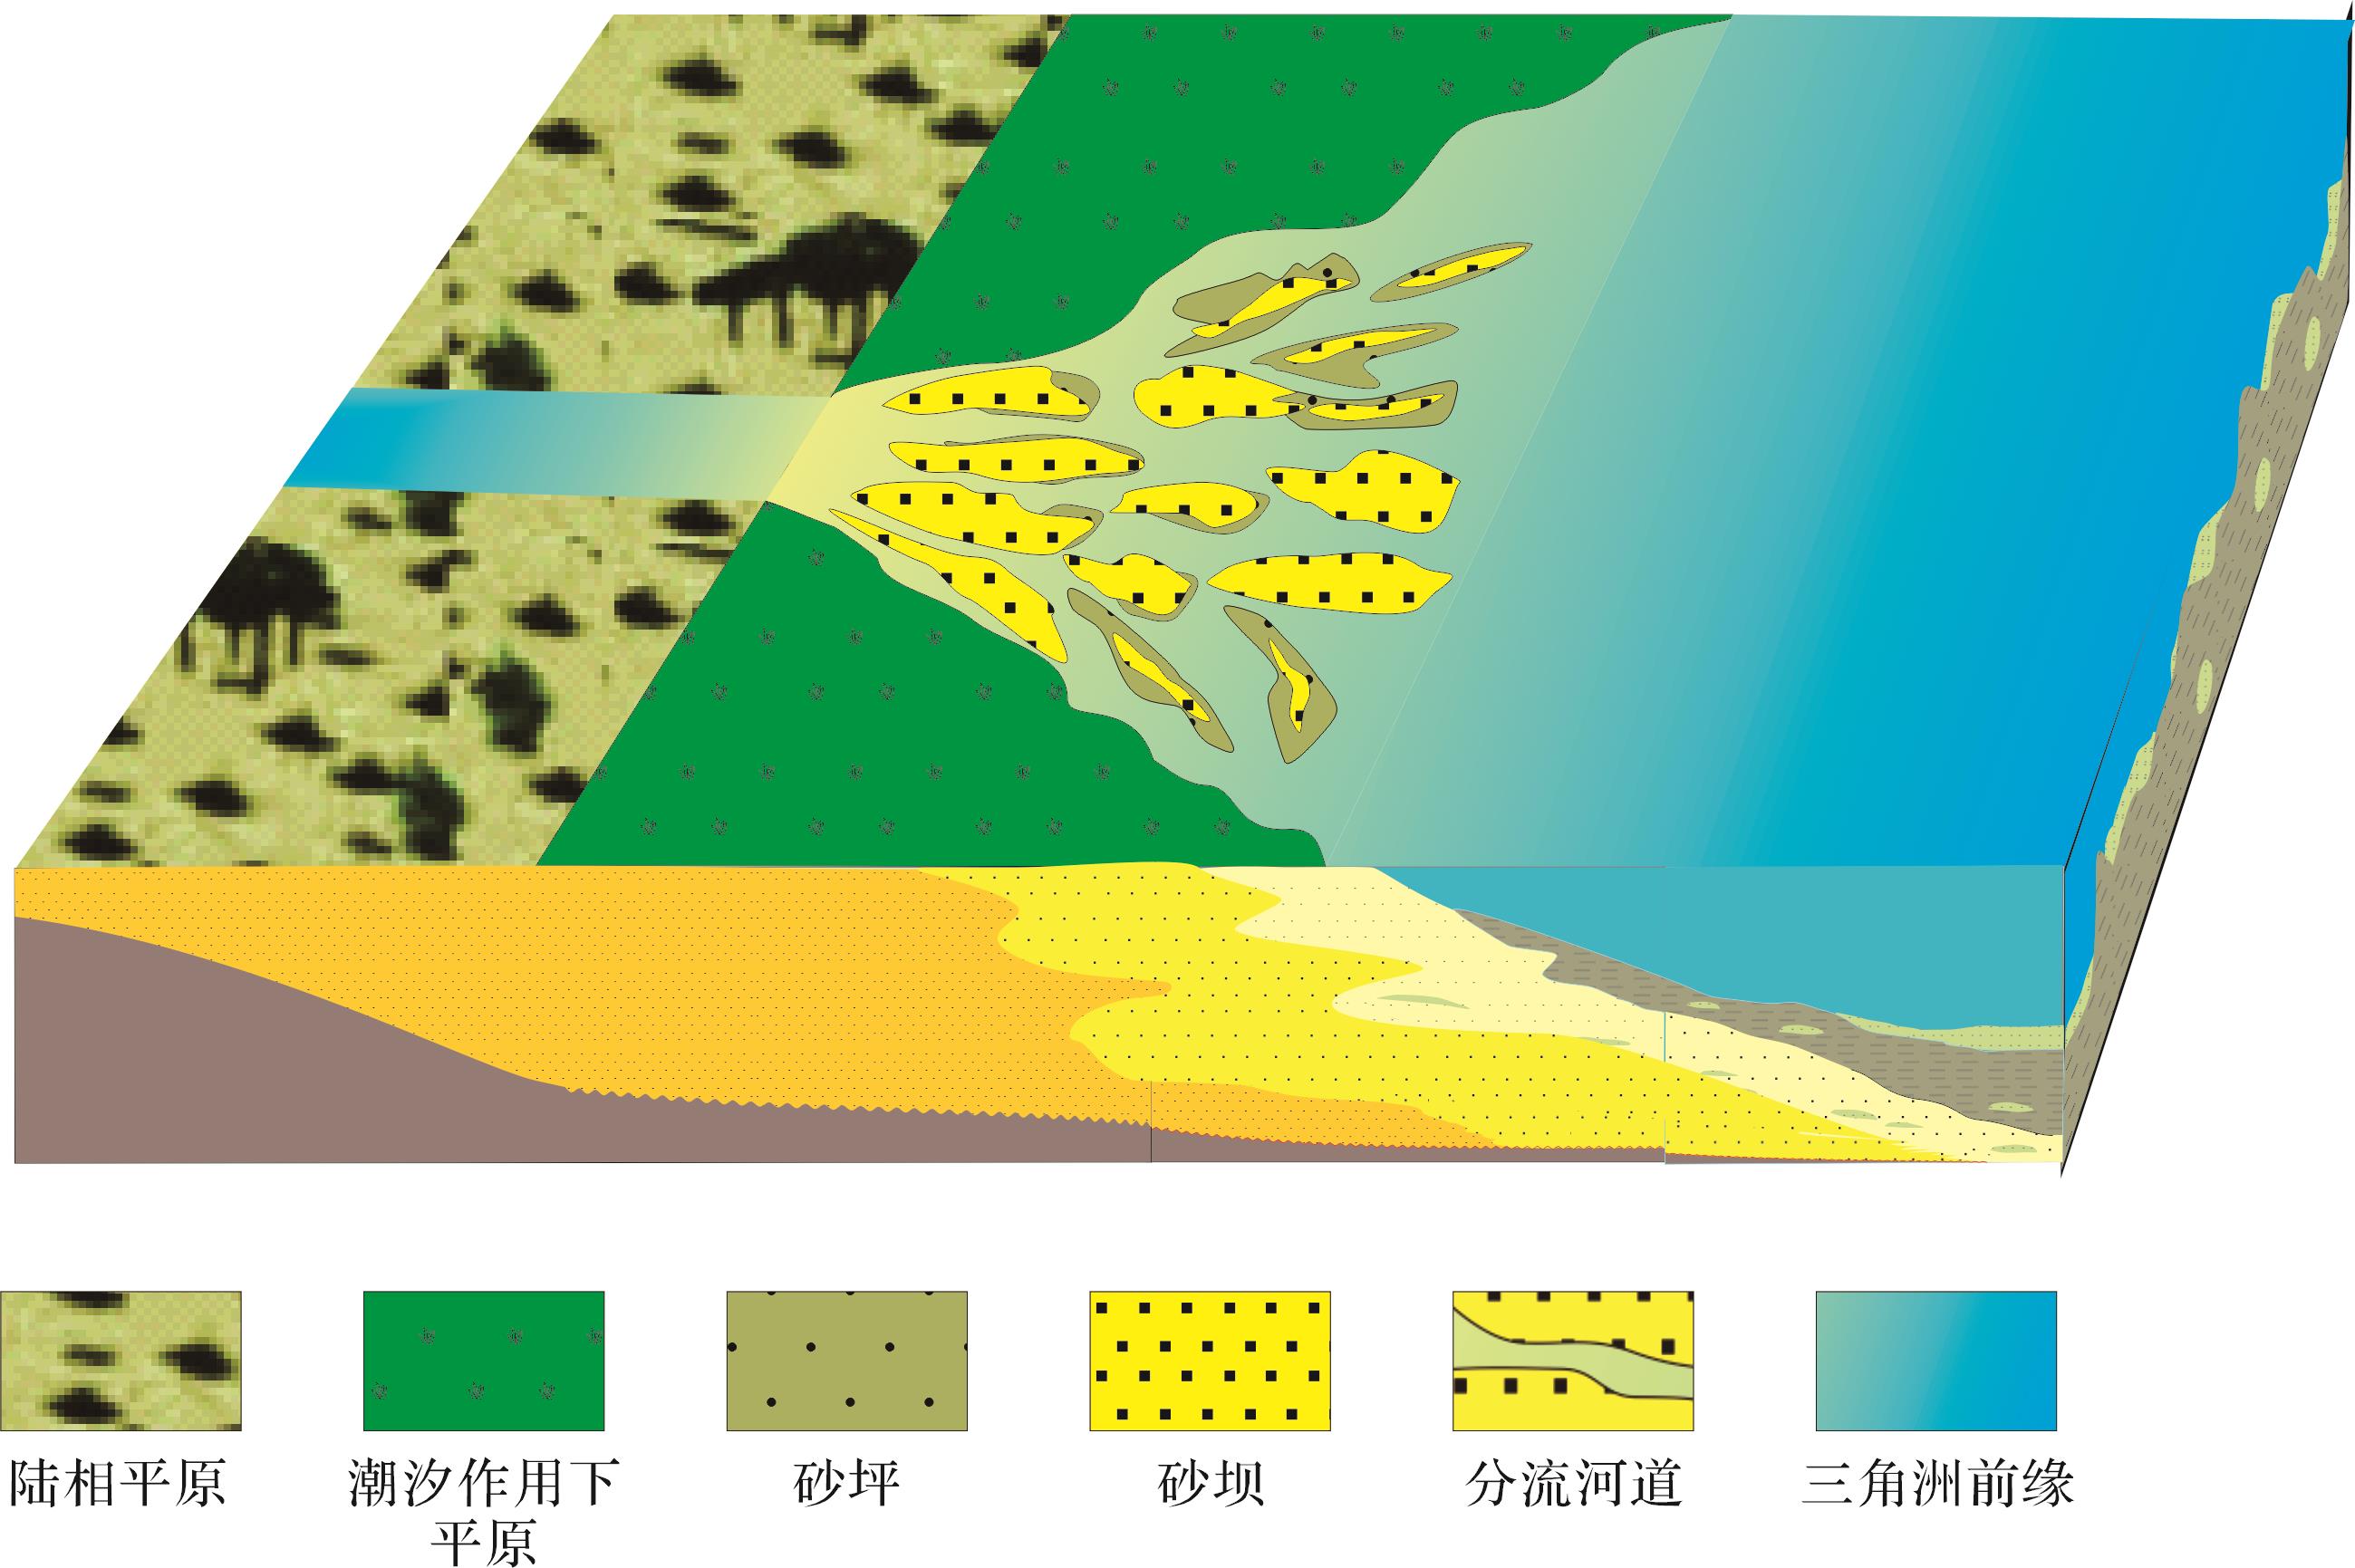
  • 潮控三角洲演化模式如图8所示。三角洲发育前期,河流携带沉积物在河口处快速沉积形成河口坝,潮汐对河口坝进行侵蚀,同时加强河流携带沉积物的能力,一定程度加强了搬运作用。分流河道逐渐生成,部分河道出现决口水道。三角洲发育中期,河口处受河流—潮汐联合作用的影响侵蚀作用最强,大量沉积物向海洋方向搬运,三角洲坝体继续堆积发育,厚度持续增加,同时受河流—潮汐联合作用的影响,水道对坝体具有侵蚀改造作用,水道侵蚀坝体,将沉积物携带至远海处或水道分流处,坝体两侧被侵蚀,向长条形发育。分流河道继续发育,河道变宽,部分河道发生截弯取直,有废弃河道生成。三角洲发育后期,位于河口处的沉积物在河流—潮汐联合作用下快速向海洋方向搬运,分流河道加宽,加强了搬运沉积物的能力,部分河道被废弃,坝体继续向海洋方向发育,坝体厚度增加。潮汐对坝体具有一定的改造作用,潮汐主要侵蚀坝体两侧,坝体呈长条形分布,潮汐将部分沉积物携带至深海,随着潮汐能量的逐渐减弱,潮汐携带沉积物的能力也逐渐减弱,沉积物在远海处发生沉积,堆积形成新的坝体,三角洲面积也随之增大。潮汐幅度越大,潮汐能量越大,携带沉积物的能力增大,沉积物发生沉积的位置也越远,三角洲面积也越大。三角洲河道继续发育,河道持续加宽,部分河道废弃,来自上游的沉积物逐渐充填废弃河道,形成新的坝体。

    Figure 8.  Sedimentary model of a tidal delta

  • (1) 河流与潮汐在潮控三角洲的建设中有着不同作用。河流主要将上游沉积物搬运至河口与三角洲,提供河流—潮汐联合作用三角洲沉积物搬运的部分动力。潮汐主要将河口的沉积物向海洋方向搬运,同时对三角洲坝体进行侵蚀改造作用,并将侵蚀的沉积物向更远处搬运,形成新的坝体,提供联合作用三角洲沉积物搬运的主要动力。

    (2) 河流流量大小与潮汐幅度大小决定坝体形态及三角洲面积。当河流流量增大时,河流携带沉积物的能力增大,搬运作用增强,为三角洲坝体发育提供更多物源。潮汐幅度的变化对坝体形态、三角洲面积具有一定程度的影响。随着潮汐幅度的增大,其携带及搬运沉积物的能力增强,在河流作用的共同作用下将沉积物携带至离河口更远处,在更远处发生沉积形成新的坝体,三角洲面积逐渐增大。同时潮汐对三角坝体具有侵蚀改造作用,潮汐幅度越大,其侵蚀能力越强,对坝体的改造也越明显。

    (3) 潮控三角洲演化主要分为三个时期。前期河流将沉积物搬运至河道,在河口发育形成河口坝,潮汐将沉积物向海洋方向搬运;中期三角洲坝体发育,有多条分流河道形成,在分流处能量减少,搬运能力减弱,沉积物发生堆积,形成新的砂坝,三角洲面积持续增长;后期河道发育成熟,部分废弃河道被沉积物充填,砂体呈长条状分布,三角洲面积继续增大,但增长速率有所减缓。

Reference (38)

Catalog

    /

    DownLoad:  Full-Size Img  PowerPoint
    Return
    Return