


HTML
-
我国华南地区中二叠统孤峰组是一套暗色硅质岩(或称为硅岩)夹页岩的沉积,同时也是一个穿时的地层单位。在中扬子和上扬子地区孤峰组主要属于卡匹敦期(Capitanian)沉积[1],而在下扬子地区孤峰组的底部和顶部分别对应中二叠瓜德鲁普世的底和顶界线,沉积时限为整个瓜德鲁普世[2⁃3],包括了罗德期、沃德期和卡匹敦期。相比中上扬子区在有限的台内盆地沉积的孤峰组硅质岩,下扬子地区的黑色硅质岩分布很广,涉及皖南、苏西、浙西北和部分赣北地区。如此大规模的黑色富有机质硅质岩是页岩气资源、沉积矿产(如锰矿)资源物质基础,其硅质岩成因、沉积成岩过程与沉积环境控制了这些化石能源与矿产资源的形成与聚集,开展基础沉积学的研究具有十分重要的意义。
下扬子地区孤峰组硅质岩自20世纪八九十年代以来受到了广泛的关注,对孤峰组硅质岩的成因与沉积环境已经有了较为成熟的认识。最初的研究从孤峰组的化石开始,认为孤峰组含大量的放射虫、海绵骨针化石[4⁃6]和薄壳的腕足[7],是一种典型的生物成因硅质岩,为上升流形成的沉积[8]。早期对孤峰组岩相和沉积相的研究认为,下扬子孤峰组硅质岩属于台地陆棚外带环境[9],相当于威尔逊碳酸盐岩台地相模式中的斜坡和陆棚相。孤峰组层状硅质岩的沉积成岩过程被认为是硅质生物死亡后,硅质骨骼发生溶解,形成硅质生物软泥,成岩形成层状硅质岩[10]。随后,对下扬子孤峰组硅质岩的地球化学分析得出关于硅质岩成因的两种观点,一种认为下扬子孤峰组层状硅质岩是热水沉积[11],热泉喷出后海水硅酸浓度升高而沉淀,同时促使硅质生物的繁盛;另一种观点则认为孤峰组是典型的生物成因硅质岩,可能混有少量热水成因硅质岩[12⁃13]。从古地理和构造背景来看,下扬子地区孤峰组沉积时期属于华南板块陆内裂陷沉积阶段,形成于拉张裂陷的盆地环境[14]。下扬子孤峰组硅质岩沉积于东特提斯多岛洋环境[15],信风带内特提斯洋东岸的洋流上涌[16]、瓜德鲁普世早期的海侵以及断陷引发的海水加深形成孤峰组沉积早期的环境分异[17],引发碳酸盐岩台地的消亡。形成了一个富含有机质的滞留缺氧硫化盆地[18⁃19],这也是目前该区非常规油气勘探在孤峰组钻获页岩气的原因所在[20]。
近期对巢湖地区孤峰组下部的泥岩和火山碎屑岩夹层的研究有了一些新的发现。高精度的锆石U-Pb同位素定年技术CA-ID-TIMS测试结果发现,孤峰组底部正是中二叠瓜德鲁普世与早二叠乌拉尔世的分界线[2]。针对孤峰组的火山灰开展地球化学分析认为,孤峰组沉积早期的火山活动与峨眉山地幔柱无关,是小规模频繁的岛弧中—酸性岩浆活动的结果[21]。进一步的分析认为,下扬子孤峰组硅质岩沉积时期正是华夏板块由被动大陆边缘转变为古太平洋俯冲引起的主动大陆边缘的转折时期[22]。基于以上研究进展,本文结合安徽铜陵叶山小涝和巢湖平顶山浅颜色热液硅质岩的发现,开展详细的地球化学分析,重新审视下扬子地区孤峰组硅质岩的成因和形成过程。
-
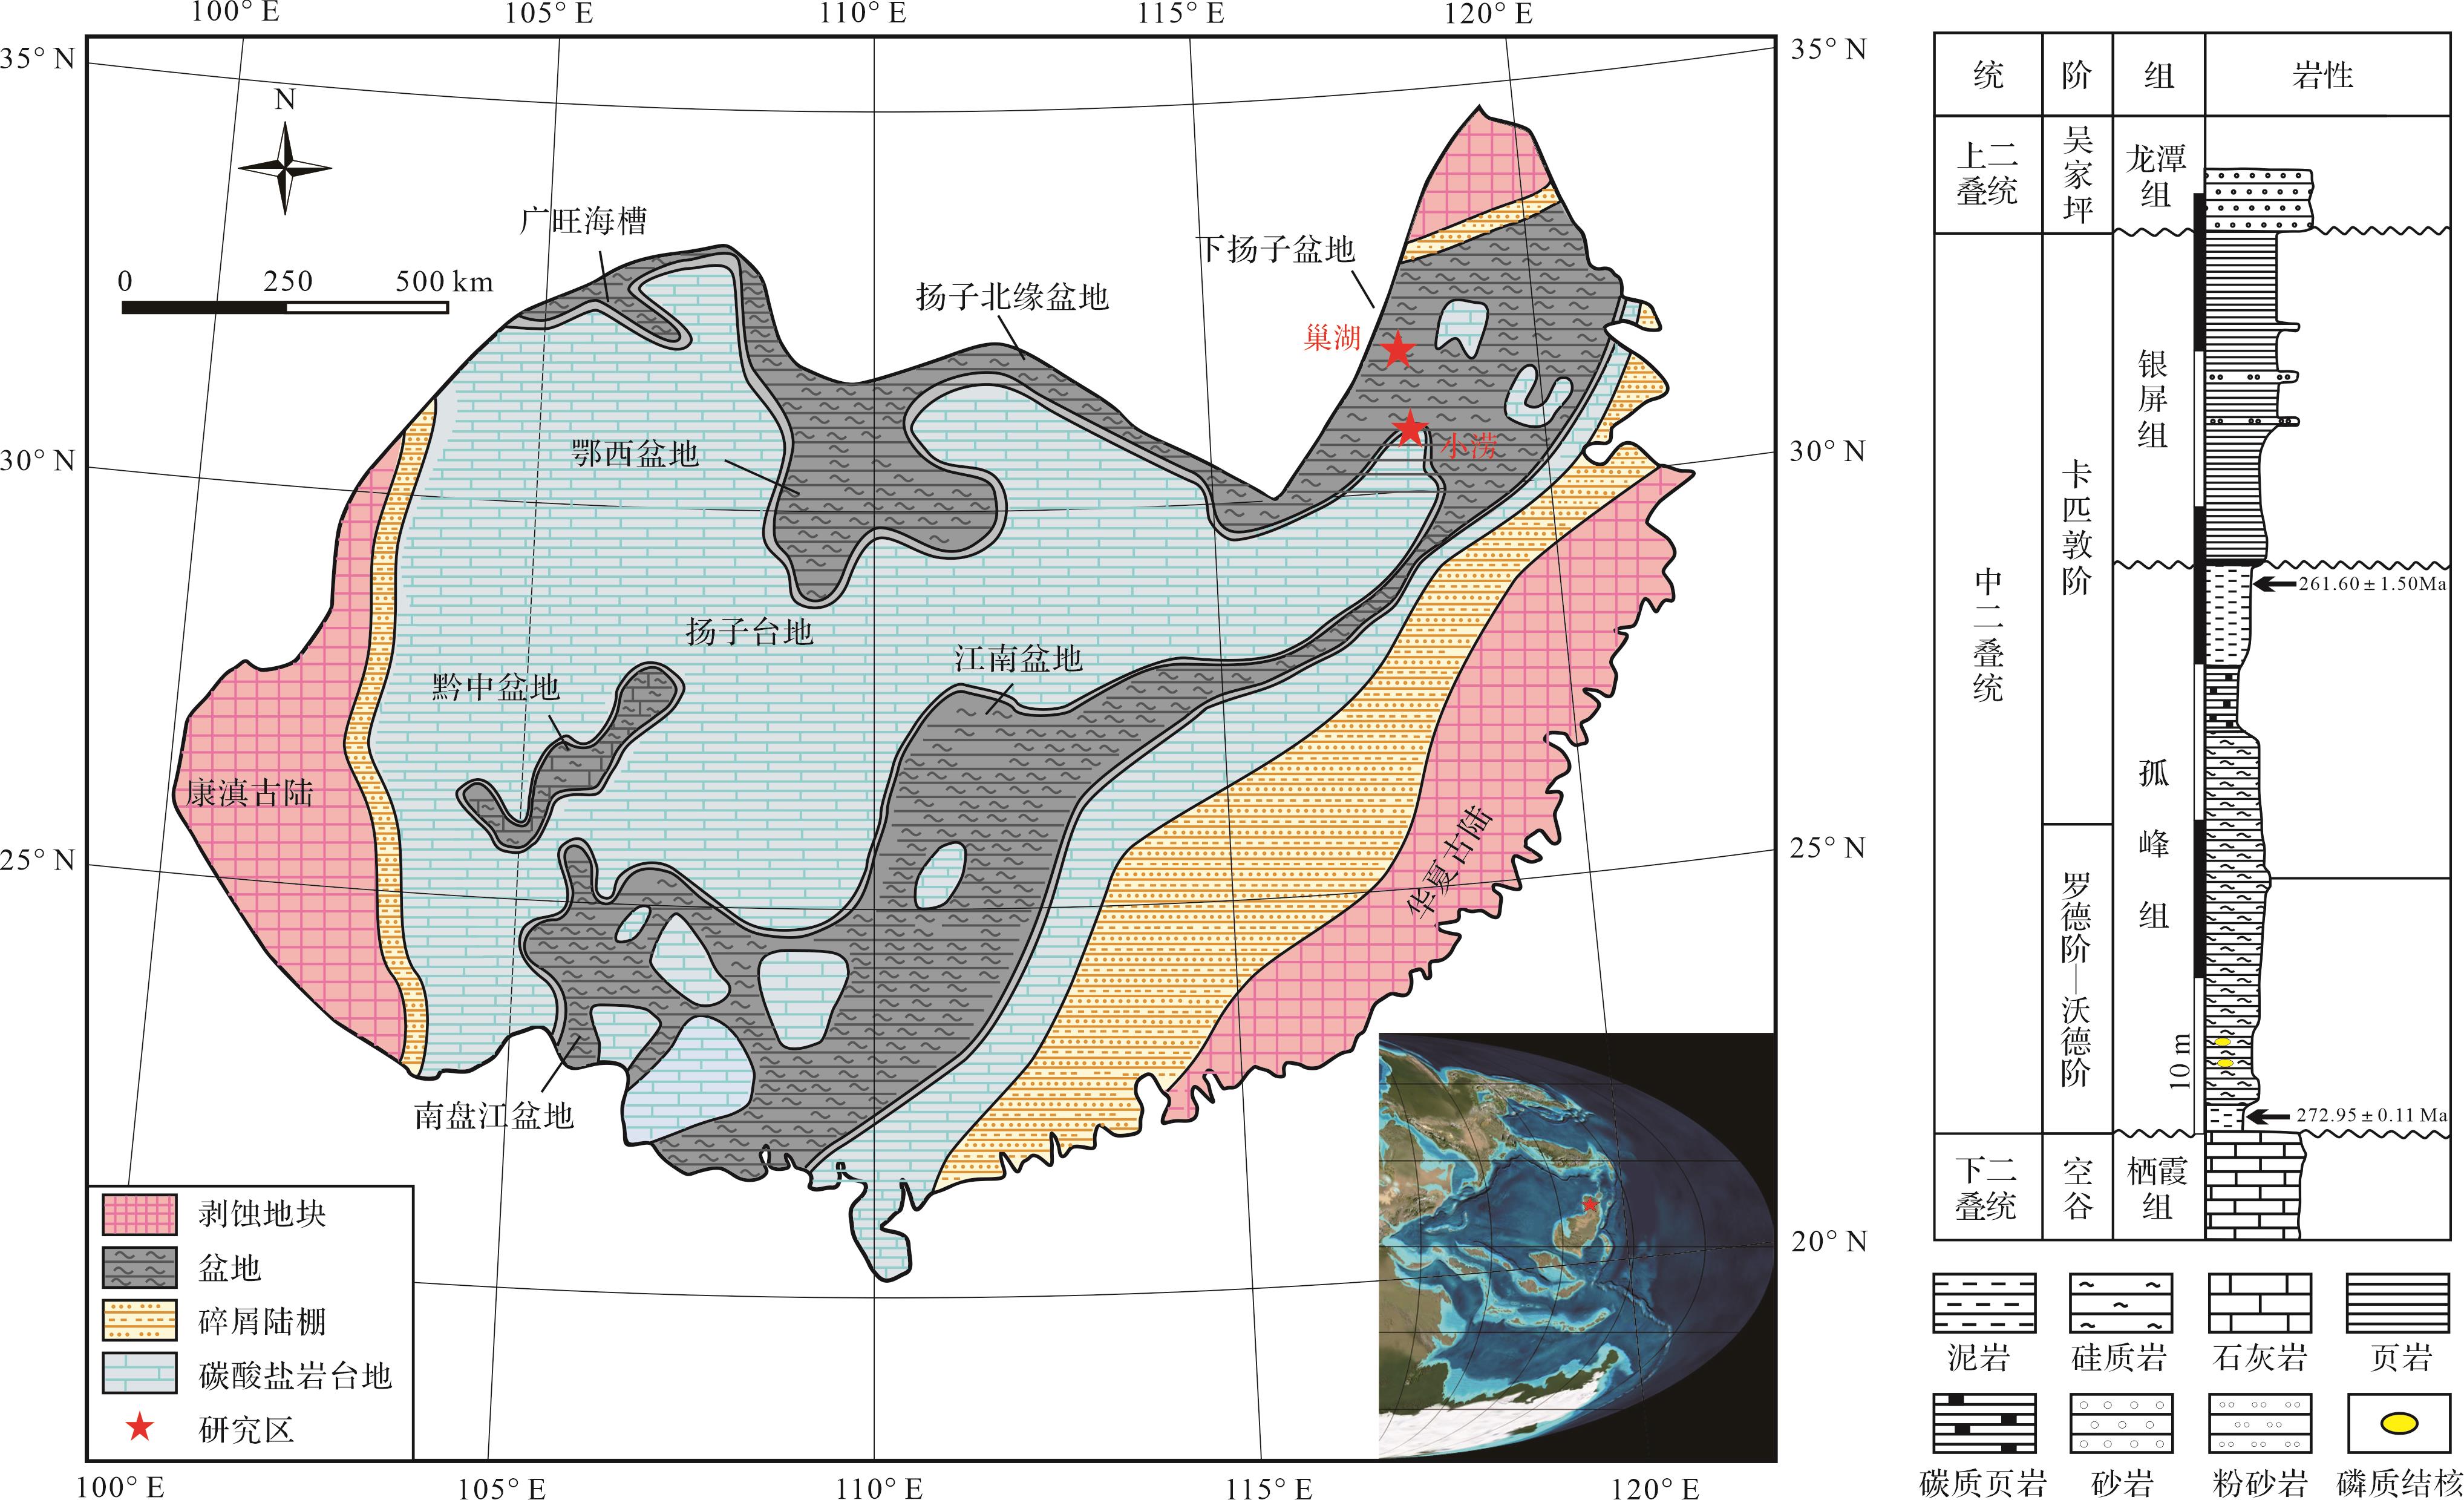
中二叠世时期,华南地块是古特提斯洋东部的一个大型热带孤立地台(图1)[18],台地内部主要发育浅滩碳酸盐岩浅海环境以及台内较深水硅质岩盆地环境。下扬子地区整体处于华南地块的北部,位于江绍断裂带和郯庐断裂带之间,西北与华北地块相邻,东南与华夏板块相连,东北部延伸至黄海,以西为中上扬子地块。该区自显生宙以来经历了多个构造阶段和多旋回的盆地生成、发展、改造、叠加过程,形成了极富个性的构造格局[23]。中二叠世期间,该区坳陷形成下扬子盆地,沉积了深水相的孤峰组黑色硅质岩[24]。Wu et al.[2]和Zhang et al. [25]分别对巢湖地区孤峰组底部和顶部地层进行了锆石U-Pb定年实验,获得了较为精确的年龄,较好地限定了孤峰组的沉积时间,即孤峰组底部为中二叠世与早二叠世的界线,而孤峰组顶部与银屏组的界线为卡匹敦晚期。

Figure 1. Paleogeography and stratigraphy of the Middle Permian in the Lower Yangtze region
-
主量元素的测定采用熔片法,在X射线荧光光谱仪(型号为SHIMADZU SEQUENTIAL XRF-1800)进行测定。粉末样品经过马弗炉高温煅烧之后与混合溶剂高温熔融制作成玻璃片而测定。试验结果分析误差优于1%。微量和稀土元素测定采用高分辨率电感耦合等离子质谱仪(型号PE350D)测定。前处理采用稀盐酸、稀硝酸、氢氟酸以及高氯酸在烘箱高温高压溶解,在电热板进行近干蒸发消解,直至所有粉末全部溶解为溶液。加内标AGV-2、BCR-2和BHVO-2,用2%的稀硝酸进行定量稀释后测定。所有的主量、微量和稀土元素的测定均是在中国地质大学(武汉)生物地质与环境地质国家重点实验室完成,其分析精度优于5%。稀土元素采用澳大利亚后太古宙平均页岩(Post- Archean Australian Shale,PAAS)进行标准化,Ce异常值Ce/Ce*计算公式为标准化后的Ce/(La+Pr)/2,Eu异常值Eu/Eu*计算公式为标准化后的Eu/(Sm+Gd)/2。
-
巢湖剖面(25°01′44″ N,113°44′18″ E)为深水盆地沉积环境,依次出露下二叠统栖霞组、中二叠统孤峰组、银屏组。栖霞组由灰色生物碎屑灰岩组成,有丰富的海百合、有孔虫、介形虫、腕足类及腹足类和双壳类,栖霞组和孤峰组呈不整合接触,表明存在沉积间断。孤峰组岩性为黑色薄层硅质岩夹页岩(图2a),有机碳含量平均高达6 wt.%[26],硅质岩中含丰富的硅质海绵骨针(图2b)和放射虫(图2c)。这些硅质骨骼生物以硅质海绵骨针为主,放射虫次之,且放射虫主要见于孤峰组的硅质岩的上部层段。银屏组由深灰色页岩组成,在风化作用下变成紫色、深灰色和白色的混合色。

Figure 2. Petrologic characteristics of the Kuhfeng Formation in the Chaohu sections, Anhui province
小涝剖面(30°56′47″ N,118°00′52″ E)为台地斜坡沉积环境,依次出露下二叠统栖霞组、中二叠统孤峰组,二者呈整合接触。剖面的孤峰组同样为硅质岩,根据形状分为两部分:下部地层为青灰色层状硅质岩,几乎不含页岩夹层(图2d),局部含瘤状石灰岩结核,其内部含层状硅质岩(图2e);上部为灰色非层状硅质岩,其内部含深灰色早成岩硅质结核(图2f)。小涝剖面孤峰组硅质岩镜下为微晶石英结构(图2g),下部层状硅质岩在镜下发育水平纹层(图2h)。孤峰组硅质岩局部发育角砾岩(图2i),角砾颗粒内部发育早成岩硅质脉(图2j)。位于孤峰组下部的青灰色层状硅质岩见少量硅质海绵骨针(图2k),而位于孤峰组上部的灰色非层状硅质岩见较多的钙质生物,如绿藻中的裸海松藻属、钙扇藻属(图2l,m)。整个孤峰组硅质岩中常见细小的钙质海绵骨针,在岩石中已经硅化为硅质(图2n,o)。
-
巢湖剖面孤峰组下部泥岩段和磷质结核段的二氧化硅含量介于45%~72%(表1),硅质泥岩至泥质硅质岩;而孤峰组中部和上部的三个段(下放射虫硅质岩段、海绵—放射虫硅质岩段、上放射虫硅质岩段)的二氧化硅含量很高,介于85%~94%,是典型的硅质岩,但含有少量泥质。总有机碳(Total Organic Carbon,TOC)含量介于0.48%~21.48%,平均值为4.52%[26],Fe/Ti比值介于2.9~19.1,平均值为11.1;Al/(Al+Fe+Mn)比值介于0.37~0.81,平均值为0.64。微量元素Sc含量介于1.48×10-6~13.2×10-6,平均值为5.38×10-6(表2);Th含量介于0.57×10-6~9.17×10-6,平均值为2.95×10-6;Ti/Zr比值介于7.7~32.3,平均值为20.4;La/Sc比值介于1.0~6.1,平均值为2.6。稀土元素La元素含量介于2.2×10-6~71.8×10-6,平均值为15.8×10-6;Eu异常值Eu/Eu*介于0.70~1.03,平均值为0.89;标准化后LuN/LaN比值介于0.45~2.2,平均值为1.23(表3)。
样品编号 CH05 CH10 CH15 CH20 CH25 CH30 CH35 CH40 CH45 CH50 CH55 CH60 CH65 CH70 CH75 CH80 CH85 CH90 CH95 SiO2 57.57 56.38 45.27 72.13 91.81 93.72 93.91 92.86 94.16 92.44 93.02 80.56 78.47 80.10 85.89 89.95 93.03 92.85 90.00 TiO2 0.63 0.38 0.43 0.38 0.06 0.05 0.08 0.12 0.05 0.05 0.05 0.16 0.22 0.19 0.14 0.10 0.09 0.12 0.20 Al2O3 13.43 9.04 8.53 7.96 1.36 1.17 2.15 2.34 1.04 1.18 1.13 4.06 5.45 3.56 1.96 3.09 1.09 2.29 3.83 Fe2O3 4.52 3.91 5.54 2.67 0.98 0.54 1.07 1.01 0.63 0.73 0.32 1.23 1.08 1.42 0.35 1.31 1.42 0.45 1.14 MnO 0.01 <0.01 0.01 <0.01 0.04 <0.01 0.02 <0.01 <0.01 <0.01 <0.01 0.03 <0.01 <0.01 <0.01 0.03 <0.01 <0.01 0.01 MgO 1.27 0.74 0.86 0.65 0.02 0.04 0.07 0.13 0.05 0.05 0.05 0.17 0.26 0.14 0.09 0.13 0.03 0.11 0.19 CaO 2.80 2.18 6.29 1.23 0.59 0.32 0.19 0.25 0.30 0.25 0.21 0.62 0.56 0.11 0.63 0.30 0.40 0.38 0.24 Na2O 0.10 <0.01 0.13 <0.01 <0.01 <0.01 <0.01 <0.01 <0.01 <0.01 <0.01 <0.01 <0.01 <0.01 <0.01 <0.01 <0.01 <0.01 <0.01 K2O 2.99 1.84 1.87 1.69 0.18 0.11 0.15 0.33 0.14 0.12 0.13 0.43 0.64 0.50 0.29 0.27 0.12 0.28 0.46 P2O5 2.45 0.98 6.55 1.28 0.13 0.04 0.05 0.07 0.02 0.04 0.02 0.05 0.03 0.03 0.02 0.03 0.03 0.02 0.03 LOI 14.66 25.04 27.16 11.59 5.21 3.76 2.40 3.23 3.91 4.76 5.48 13.19 15.17 16.44 12.65 4.44 4.00 3.82 3.95 Fe/Ti 8.38 12.01 15.04 8.20 19.07 12.61 15.62 9.83 14.71 17.05 7.47 8.98 5.73 8.73 2.92 15.30 18.42 4.38 6.66 Al/(Al+Fe+Mn) 0.69 0.64 0.54 0.69 0.50 0.62 0.60 0.64 0.56 0.55 0.73 0.71 0.79 0.65 0.81 0.64 0.37 0.79 0.72 Table 1. Major element data in the Kuhfeng Formation, Chaohu section (wt.%)
样品 CH05 CH10 CH15 CH20 CH25 CH30 CH35 CH40 CH45 CH50 CH55 CH60 CH65 CH70 CH75 CH80 CH85 CH90 CH95 Sc 13.20 9.38 10.40 11.7 2.50 1.48 2.57 3.24 2.31 2.30 2.88 6.04 7.16 6.51 3.86 5.65 2.78 3.42 4.81 Cr 421 962 1 282 674 298 121 136 394 245 216 213 855 802 769 402 413 75 267 169 Co 10.40 7.25 3.01 0.75 1.61 0.69 2.28 0.43 0.84 1.23 0.76 1.45 1.52 0.65 0.57 1.45 1.03 0.59 11.30 Ni 132 193 203 125 63.7 42.1 59.2 38.5 41.9 44.7 36.9 98.9 155 51.4 124 64 75.4 50.2 38.5 Cu 55.3 124.0 56.5 46.4 31.3 21.5 25.4 15.9 20.4 80.7 25.1 56.5 151.0 93.8 18.0 43.1 26.2 36.1 58.6 Th 9.17 6.32 6.15 7.62 0.79 0.57 1.36 1.49 0.91 0.73 0.63 2.33 4.09 3.07 2.10 1.85 1.82 2.14 2.98 Ba 204.0 175.0 441.0 167.0 42.8 57.6 63.9 36.0 30.7 27.8 25.6 40.0 98.0 69.6 85.8 105.0 127.0 117.0 110.0 La/Sc 2.3 3.1 2.9 6.1 1.6 1.5 2.1 2.1 1.5 2.3 1.1 2.1 3.2 2.6 4.4 1.0 3.4 2.6 3.1 Ti/Zr 32.3 20.5 32.1 18.5 13.2 31.5 24.5 31.8 21.3 20.1 24.6 24.5 16.4 15.0 13.3 9.6 7.7 17.9 13.7 Table 2. Trace element data in the Kuhfeng Formation, Chaohu section (×10-6)
样品编号 CH05 CH10 CH15 CH20 CH25 CH30 CH35 CH40 CH45 CH50 CH55 CH60 CH65 CH70 CH75 CH80 CH85 CH90 CH95 La 30.20 29.30 30.10 71.8 3.94 2.19 5.48 6.92 3.56 5.31 3.03 12.70 22.60 17.10 16.90 5.76 9.41 9.05 15.10 Ce 53.30 36.70 43.80 109.00 5.74 3.00 7.37 11.00 5.28 7.30 4.32 18.00 46.20 34.00 33.10 12.30 19.10 14.70 25.40 Pr 6.86 5.69 6.45 11.90 0.93 0.49 1.18 1.65 0.91 1.18 0.72 2.76 5.01 3.75 3.44 1.44 1.80 2.11 3.05 Nd 27.20 22.60 25.90 41.70 3.72 1.96 4.70 6.13 3.67 4.64 2.92 10.50 18.60 14.10 12.60 5.71 5.78 7.91 10.40 Sm 5.27 4.56 5.27 6.49 0.69 0.41 0.91 1.09 0.63 0.97 0.62 1.86 3.04 2.51 1.96 1.37 0.80 1.18 1.27 Eu 1.07 0.97 1.15 1.01 0.14 0.10 0.19 0.20 0.12 0.19 0.13 0.35 0.41 0.39 0.34 0.28 0.15 0.22 0.25 Gd 5.21 5.12 5.43 5.81 0.77 0.46 1.07 1.00 0.60 1.11 0.63 1.92 2.53 1.97 1.85 1.42 0.78 1.11 1.55 Tb 0.78 0.82 0.81 0.70 0.12 0.07 0.16 0.14 0.09 0.17 0.09 0.29 0.38 0.30 0.24 0.22 0.11 0.17 0.23 Dy 4.58 5.28 4.81 3.54 0.83 0.42 1.06 0.80 0.49 1.12 0.54 1.75 2.47 1.88 1.34 1.33 0.65 1.04 1.49 Ho 0.89 1.10 0.95 0.67 0.19 0.09 0.23 0.16 0.10 0.23 0.10 0.36 0.52 0.41 0.29 0.27 0.15 0.22 0.33 Er 2.61 3.37 2.74 2.09 0.61 0.25 0.70 0.48 0.30 0.68 0.32 1.09 1.61 1.22 0.90 0.80 0.53 0.71 1.07 Tm 0.39 0.51 0.39 0.33 0.10 0.04 0.10 0.10 0.05 0.10 0.05 0.16 0.25 0.19 0.13 0.13 0.10 0.12 0.17 Yb 2.62 3.42 2.46 2.35 0.64 0.25 0.64 0.44 0.29 0.63 0.30 1.12 1.66 1.25 0.89 0.86 0.71 0.76 1.14 Lu 0.40 0.54 0.38 0.37 0.10 0.04 0.10 0.07 0.04 0.10 0.05 0.18 0.24 0.19 0.14 0.13 0.11 0.12 0.18 Eu/Eu* 0.96 0.94 1.01 0.77 0.90 1.03 0.89 0.90 0.92 0.85 0.98 0.87 0.70 0.83 0.84 0.94 0.89 0.90 0.82 LuN/LaN 1.15 1.60 1.10 0.45 2.20 1.39 1.58 0.88 1.07 1.59 1.35 1.23 0.92 0.96 0.72 1.96 1.01 1.15 1.03 Table 3. Rare earth element (REE) data in the Kuhfeng Formation, Chaohu section (×10-6)
小涝剖面孤峰组硅质岩的二氧化硅含量很高,为96%~99%(表4),是很纯的硅质岩,泥质含量极低。TOC含量介于0.03%~0.66%,平均值为0.22%[26],Fe/Ti比值介于16.4~46.7,平均值为30.6;Al/(Al+Fe+Mn)比值介于0.05~0.49,平均值为0.29。微量元素Co、Ni、Cu、Cr、Ba含量变化很大,局部可高达n100×10-6~1 000×10-6(表5)。Sc含量介于0.9×10⁻⁶~10.1×10⁻⁶,平均值为2.3×10⁻⁶;Th含量介于0.2×10⁻⁶~18.7×10⁻⁶,平均值为1.3×10⁻⁶;La/Sc比值介于0.6~4.8,平均值为1.9;Ti/Zr比值介于16.2~97.2,平均值为52.9。铜陵小涝剖面稀土元素La含量介于1.7×10-6~48.2×10-6,平均值为7.3×10-6;Eu异常值Eu/Eu*介于0.66~1.37,平均值为1.05;标准化后LuN/LaN比值介于0.63~2.77,平均值为1.38(表6)。
样品编号 XL05 XL10 XL15 XL20 XL25 XL30 XL35 XL40 XL45 XL50 XL55 XL60 XL65 XL70 XL75 XL80 XL85 XL90 SiO2 58.20 4.10 96.39 96.70 97.23 97.89 97.09 96.88 97.18 96.55 96.96 97.83 97.86 98.70 98.57 98.51 98.08 98.37 TiO2 <0.01 0.02 0.02 0.03 0.03 0.03 0.03 0.03 0.03 0.04 0.04 0.03 0.03 0.03 0.03 0.03 0.03 0.03 Al2O3 12.53 0.13 0.21 0.69 0.76 0.47 0.67 0.57 0.55 0.99 0.90 0.46 0.58 0.26 0.34 0.29 0.67 0.42 TFe2O3 4.77 0.35 0.80 0.42 0.81 0.97 1.05 0.47 1.01 1.41 1.06 1.02 0.42 0.8 0.79 0.85 0.46 0.78 MnO 5.71 1.40 0.13 0.13 0.17 0.13 0.13 0.09 0.19 0.17 0.08 0.10 0.04 0.12 0.09 0.12 0.11 0.09 MgO 4.51 2.33 0.20 0.07 0.08 0.04 0.09 0.10 0.08 0.06 0.09 0.03 0.04 0.02 0.03 0.01 0.05 0.03 CaO <0.01 43.79 1.12 0.42 0.13 0.15 0.22 0.40 0.17 0.09 0.04 0.06 0.05 0.06 0.05 0.06 0.11 0.07 Na2O <0.01 <0.01 <0.01 <0.01 <0.01 <0.01 <0.01 <0.01 <0.01 <0.01 <0.01 <0.01 <0.01 <0.01 <0.01 <0.01 <0.01 <0.01 K2O 3.64 0.05 0.07 0.10 0.08 0.06 0.08 0.10 0.08 0.13 0.21 0.06 0.10 0.04 0.06 0.05 0.07 0.05 P2O5 4.04 0.04 0.05 0.17 0.02 0.06 0.02 0.05 0.02 0.03 0.01 0.01 0.01 0.01 0 0.01 0.02 0.01 LOI 8.55 47.79 1.37 1.05 0.59 0.57 0.95 1.15 0.74 0.92 0.99 0.65 0.87 0.36 0.40 0.46 0.73 0.46 总计 102 100 100 100 100 100 100 100 100 100 100 100 100 100 100 100 100 100 Mn 4.42 1.08 0.10 0.10 0.13 0.10 0.10 0.07 0.15 0.13 0.06 0.08 0.03 0.09 0.07 0.09 0.09 0.07 Al 6.63 0.07 0.11 0.37 0.40 0.25 0.35 0.30 0.29 0.52 0.48 0.24 0.31 0.14 0.18 0.15 0.35 0.22 Fe 3.34 0.25 0.56 0.29 0.57 0.68 0.74 0.33 0.71 0.99 0.74 0.71 0.29 0.56 0.55 0.60 0.32 0.55 Fe/Ti 17.51 46.71 16.35 31.53 37.75 40.87 18.29 39.31 41.16 30.94 39.70 16.35 31.14 30.75 33.08 17.90 30.36 Al/(Al+Fe+Mn) 0.46 0.05 0.14 0.48 0.37 0.24 0.30 0.43 0.25 0.32 0.37 0.24 0.49 0.17 0.22 0.18 0.47 0.27 Table 4. Major element data in the Kuhfeng Formation, Xiaolao section (wt.%)
样品 XL05 XL10 XL15 XL20 XL25 XL30 XL35 XL40 XL45 XL50 XL55 XL60 XL65 XL70 XL75 XL80 XL85 XL90 Sc 10.10 1.55 2.26 2.27 0.92 1.71 1.79 1.66 2.05 2.33 2.14 1.81 1.97 1.89 1.59 1.22 1.47 3.45 Cr 226 9 57 39 353 94 72 30 76 83 72 64 27 65 69 63 11 60 Co 10.2 3.31 1.39 115 18 1.27 1.66 136 1.47 1.93 1.66 1.31 163 1.45 0.89 1.21 167 0.96 Ni 199 47 16 48 903 7 11 55 11 16 14 9 62 12 6 6 68 5 Cu 57 2 4 8 37 6 7 11 14 12 8 7 9 6 6 5 7 5 Th 18.70 0.26 0.26 0.20 0.42 0.31 0.42 0.34 0.37 0.50 0.48 0.26 0.42 0.17 0.26 0.21 0.36 0.27 Ba 390 17 11 17 13 9 23 164 27 28 15 16 22 11 10 21 21 15 La/Sc 4.8 4.6 1.0 2.0 1.8 1.3 1.1 1.2 1.6 2.9 1.4 2.3 2.0 0.9 1.3 1.6 1.6 0.6 Ti/Zr 61.6 53.3 76.9 40.0 51.7 42.9 42.1 40.7 40.6 37.1 58.0 41.8 97.2 56.6 86.1 55.9 16.2 Table 5. Trace element data in the Kuhfeng Formation, Xiaolao section (×10-6)
样品编号 XL05 XL10 XL15 XL20 XL25 XL30 XL35 XL40 XL45 XL50 XL55 XL60 XL65 XL70 XL75 XL80 XL85 XL90 La 48.2 7.19 2.36 4.59 1.67 2.16 1.91 2.04 3.35 6.70 3.00 4.17 3.94 1.74 2.10 1.94 2.37 1.98 Ce 80.7 4.14 1.56 3.73 2.37 2.52 2.65 2.45 2.81 3.82 3.2 1.76 4.89 2.33 2.77 2.12 2.45 1.63 Pr 10.4 0.86 0.40 0.85 0.36 0.58 0.55 0.51 0.63 1.49 0.76 0.90 0.94 0.34 0.46 0.43 0.54 0.47 Nd 42.7 3.36 1.60 3.46 1.58 2.6 2.58 2.36 2.61 5.91 3.11 3.48 3.70 1.30 1.81 1.70 2.29 1.88 Sm 9.12 0.60 0.29 0.69 0.4 0.70 0.66 0.6 0.58 1.30 0.79 0.78 0.83 0.31 0.41 0.39 0.54 0.39 Eu 1.29 0.14 0.061 0.15 0.092 0.16 0.15 0.19 0.14 0.29 0.19 0.17 0.20 0.074 0.097 0.094 0.12 0.084 Gd 9.31 0.72 0.34 0.81 0.46 0.77 0.71 0.69 0.59 1.22 0.78 0.69 0.83 0.31 0.43 0.36 0.55 0.35 Tb 1.47 0.11 0.045 0.12 0.078 0.13 0.12 0.12 0.093 0.190 0.140 0.110 0.160 0.055 0.075 0.061 0.085 0.054 Dy 8.94 0.74 0.28 0.74 0.48 0.83 0.77 0.77 0.59 1.15 0.92 0.64 0.95 0.34 0.49 0.39 0.53 0.33 Y 63.8 8.88 3.00 7.46 3.98 6.24 6.54 6.94 4.01 7.01 5.73 3.36 5.33 1.95 2.89 1.93 3.78 1.82 Ho 1.780 0.160 0.057 0.150 0.094 0.160 0.160 0.160 0.110 0.210 0.180 0.110 0.180 0.061 0.091 0.070 0.100 0.058 Er 5.18 0.49 0.15 0.42 0.27 0.44 0.45 0.44 0.32 0.58 0.50 0.31 0.49 0.17 0.26 0.20 0.28 0.16 Tm 0.75 0.065 0.02 0.06 0.037 0.063 0.067 0.061 0.046 0.081 0.075 0.045 0.075 0.025 0.039 0.03 0.042 0.023 Yb 4.67 0.40 0.12 0.34 0.23 0.38 0.43 0.37 0.29 0.51 0.49 0.30 0.45 0.16 0.26 0.20 0.27 0.15 Lu 0.700 0.061 0.017 0.051 0.033 0.054 0.061 0.054 0.043 0.074 0.069 0.038 0.065 0.021 0.035 0.027 0.038 0.021 Eu/Eu* 0.66 0.99 0.90 0.93 1.00 1.02 1.02 1.37 1.12 1.08 1.14 1.09 1.13 1.12 1.08 1.18 1.03 1.07 LuN/LaN 1.26 0.74 0.63 0.96 1.72 2.17 2.77 2.30 1.11 0.96 2.00 0.79 1.43 1.05 1.45 1.21 1.39 0.92 Table 6. REE data in the Kuhfeng Formation, Xiaolao section (×10-6)
-
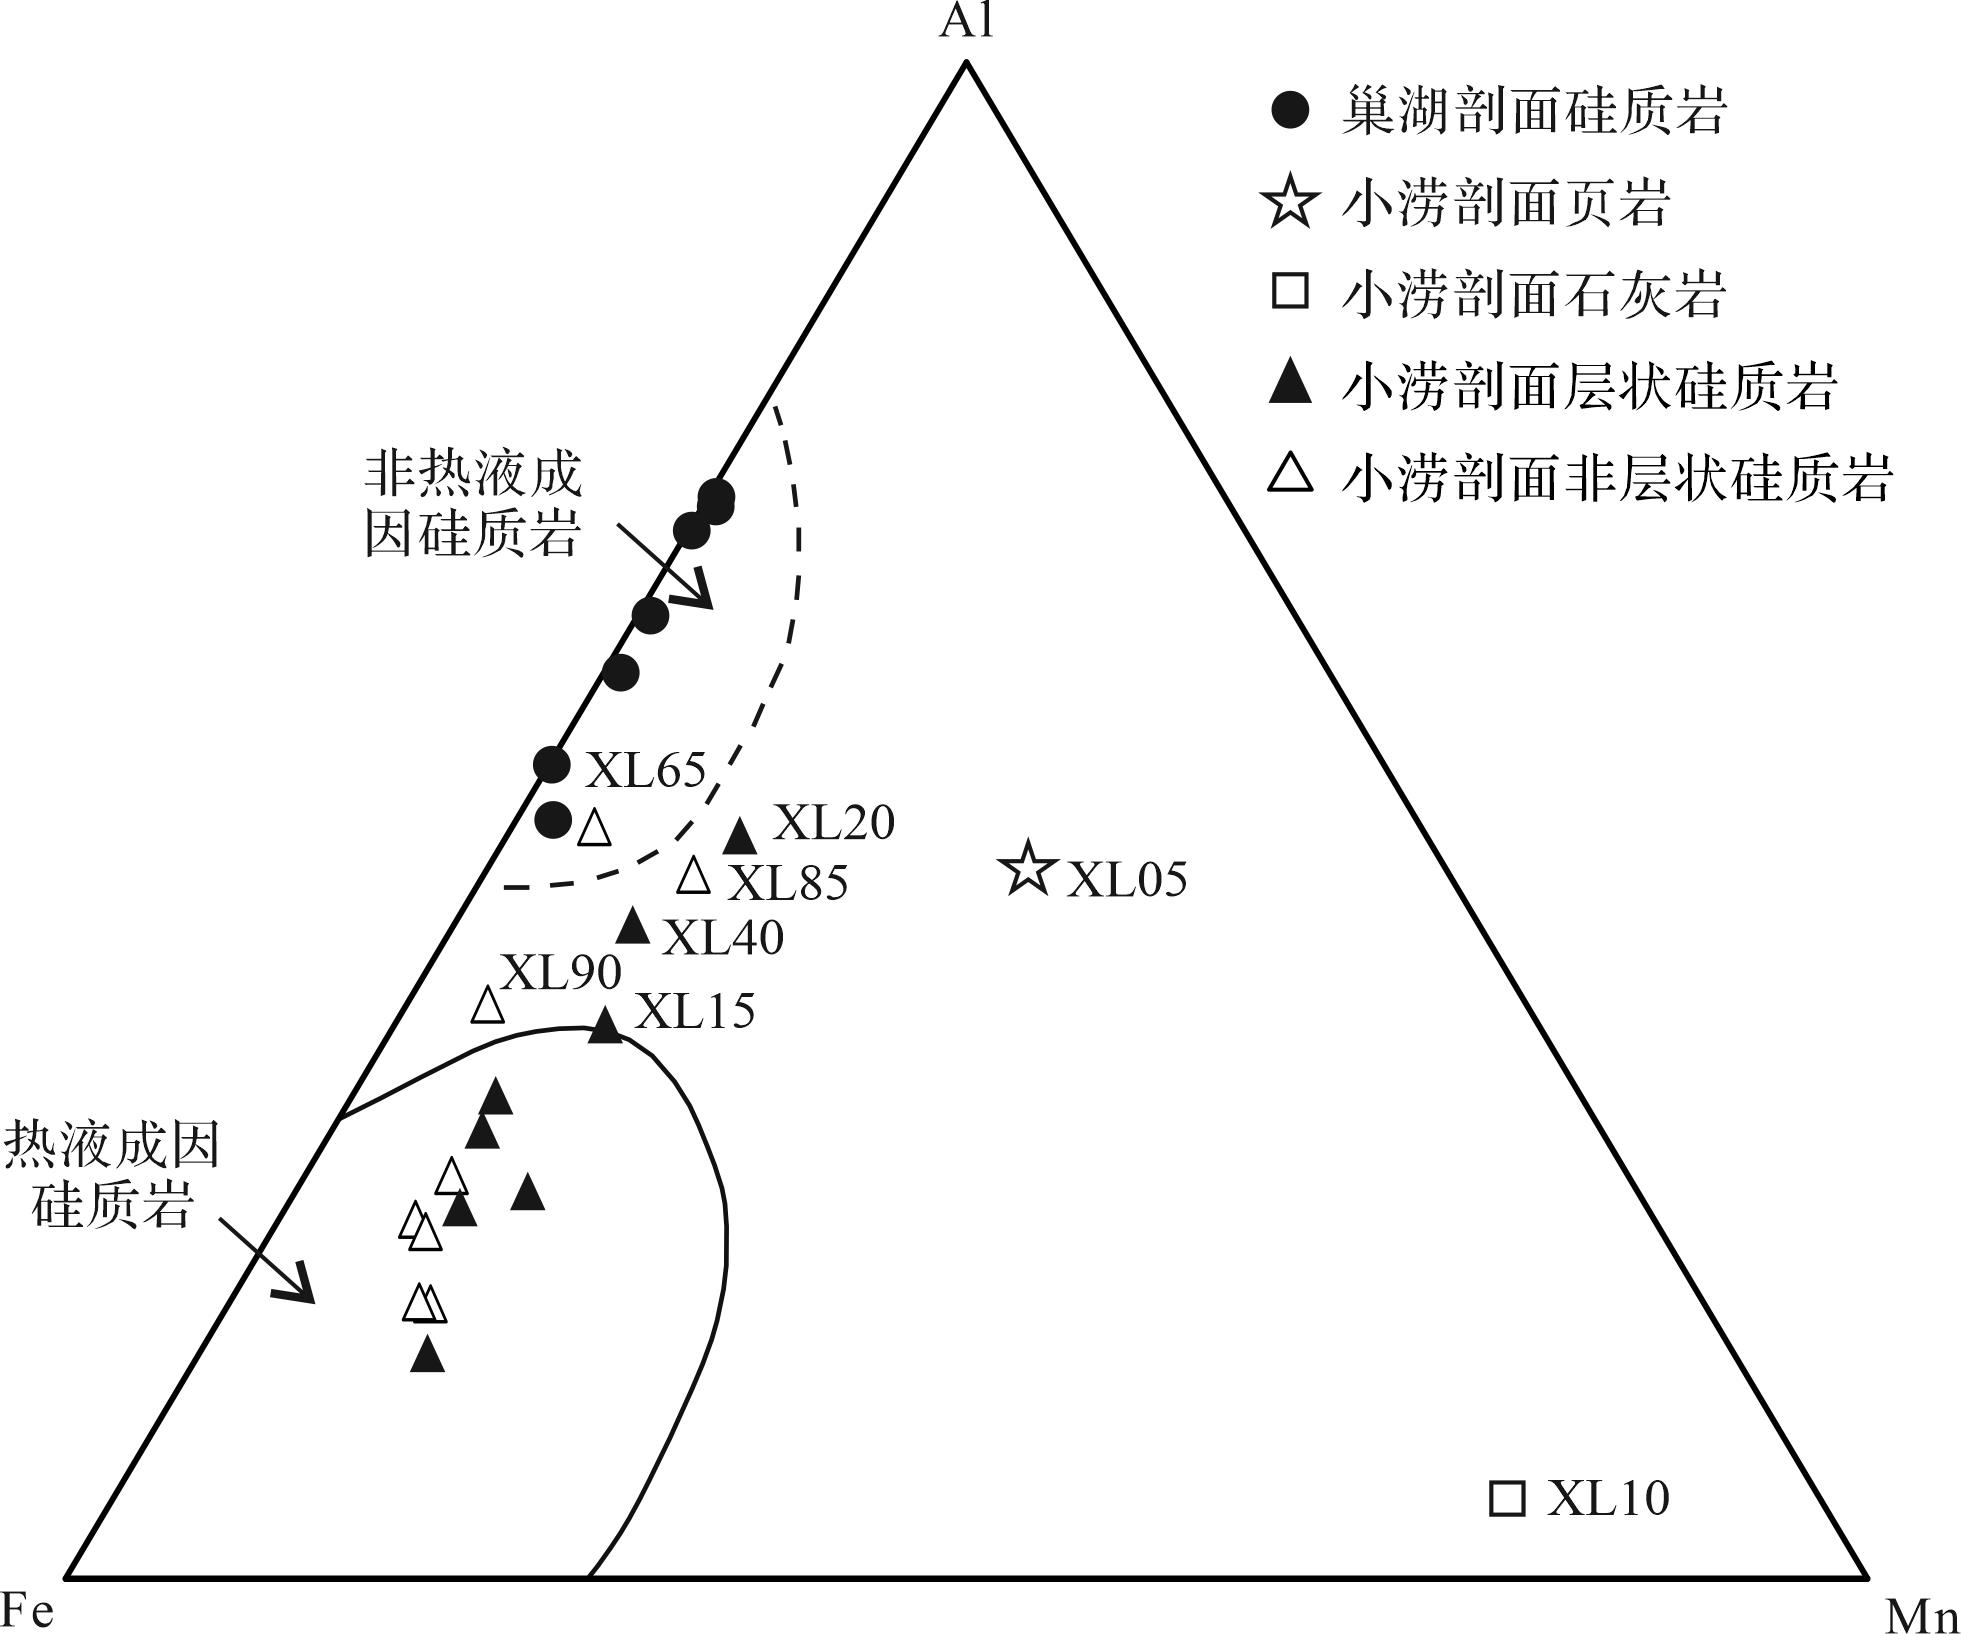
Al和Ti共同出现在铝硅酸盐矿物相中,是指示陆源输入的良好指标;而铁一般富集于洋中脊富金属沉积物,是指示热液活动输入的优质参数[27]。Adachiet al.[28]通过统计现代海洋热液系统和正常生物成因的硅质岩制作了Al-Fe-Mn三角图版,以区分热液和非热液成因的硅质岩。海相沉积物中Al/(Al+Fe+Mn)比值也被用于测量热液活动对沉积物沉积的贡献[29]。他们认为东太平洋洋脊热液的沉淀物中Al/(Al+Fe+Mn)比值低至0.01,而半远洋硅质岩沉积物中该比值为0.60。热液的影响越强,Al/(Al+Fe+Mn)比值越低,热液的影响越弱,该比值则越高[28]。安徽巢湖剖面和小涝剖面的孤峰组硅质岩的Al-Fe-Mn三角图表明,巢湖剖面孤峰组硅质岩为非热液成因硅质岩,而小涝剖面孤峰组硅质岩大部分样品均为热液成因(图3)。这些结论与沉积物岩相特征吻合,巢湖剖面孤峰组硅质岩中富含硅质海绵骨针以及放射虫(图2a~c),说明硅质岩为生物成因,而非热液成因;小涝剖面硅质岩为青灰色层状和非层状,几乎不含硅质生物,以微晶石英为主要矿物(图2d~h),这从侧面上也支持了热液成因,而非生物成因。

Figure 3. Al⁃Fe⁃Mn diagram of the Kuhfeng Formation in the Chaohu and Xiaolao sections, Anhui province(after reference [28])
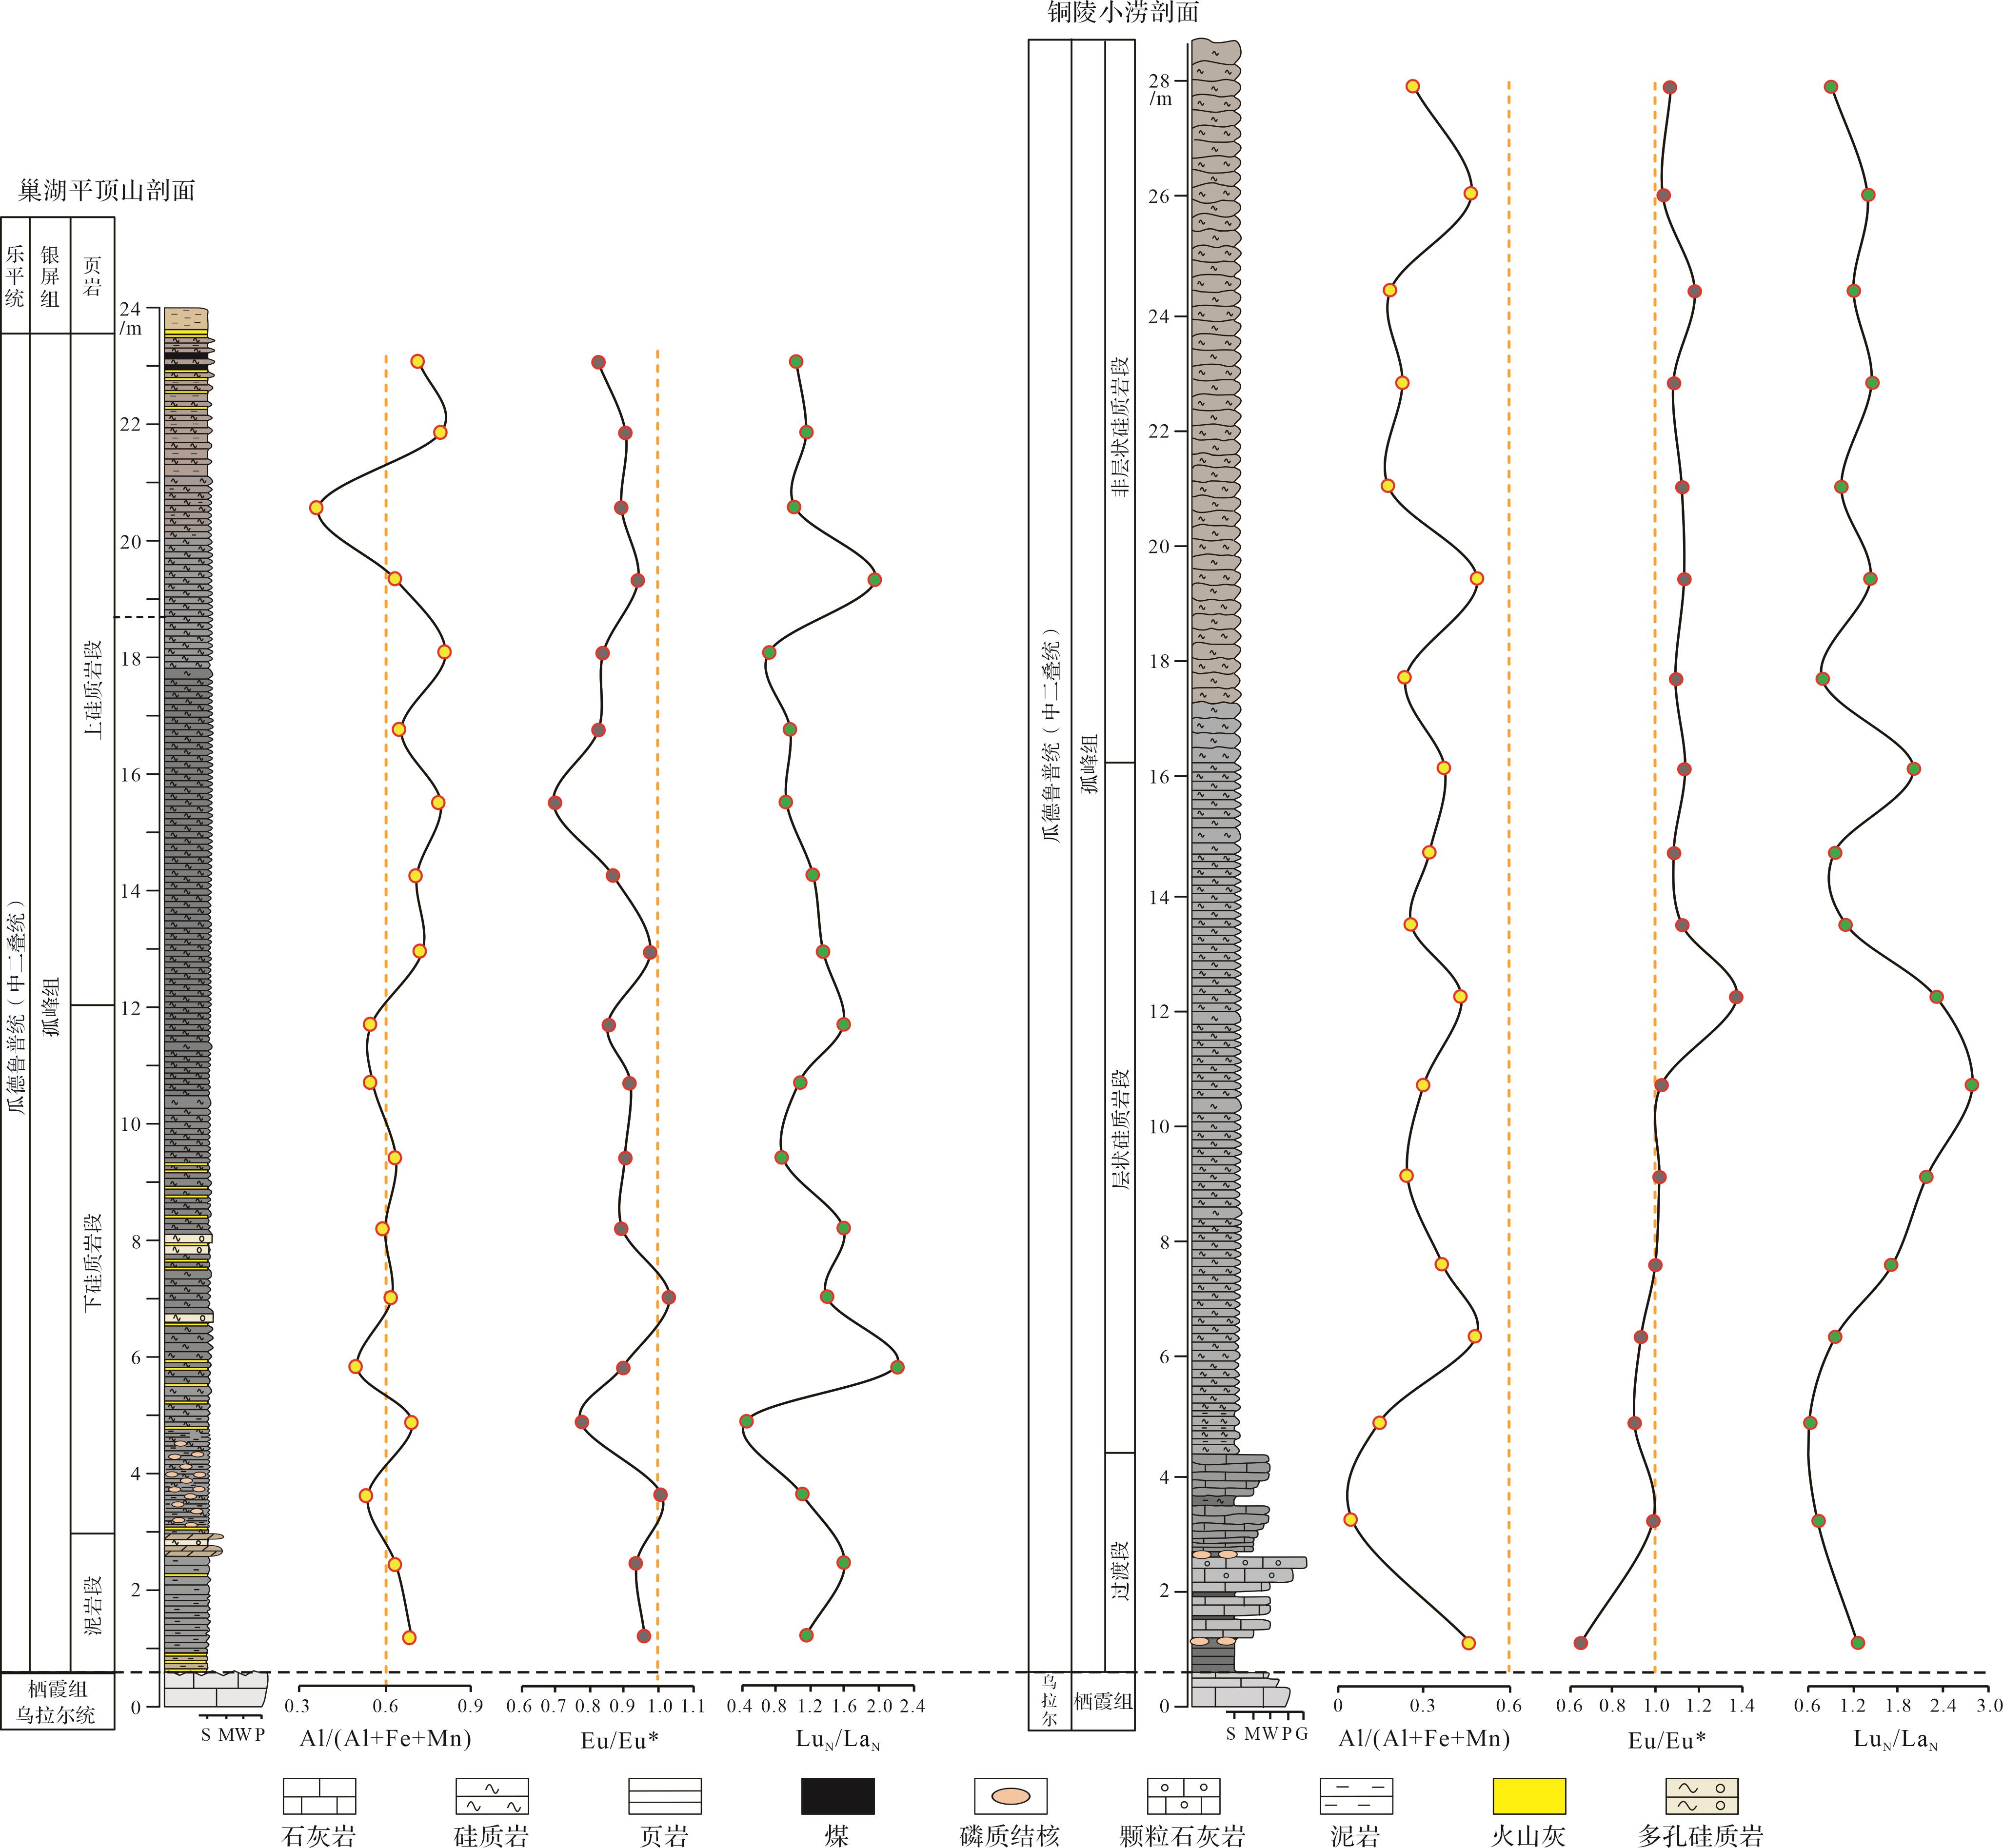
巢湖剖面孤峰组硅质岩的Al/(Al+Fe+Mn)比值大部分大于0.6,仅在孤峰组下部的下硅质岩段中出现小于0.6的样品(图4),说明巢湖地区在孤峰组硅质岩沉积早期可能受到热液作用的影响。除了巢湖地区,夏邦栋等[11]对繁昌桃冲、泾县昌桥三个地区的孤峰组黑色层状硅质岩样品Al/(Al+Fe+Mn)分析,同样指示存在热液作用的影响。说明下扬子地区黑色层状硅质岩虽然表面上是生物成因,但其硅的来源很可能与热液活动有关。巢湖剖面孤峰组硅质岩部分样品较高的Fe/Ti比值与小涝剖面的样品接近(表1,4),也支持了上述结论。这是因为沉积物经历了热液活动的输入,其Fe/Ti比值较高[28]。

Figure 4. Chemostratigraphic profiles for the hydrothermal proxies in the Kuhfeng Formation in the Chaohu and Xiaolao sections, Anhui province
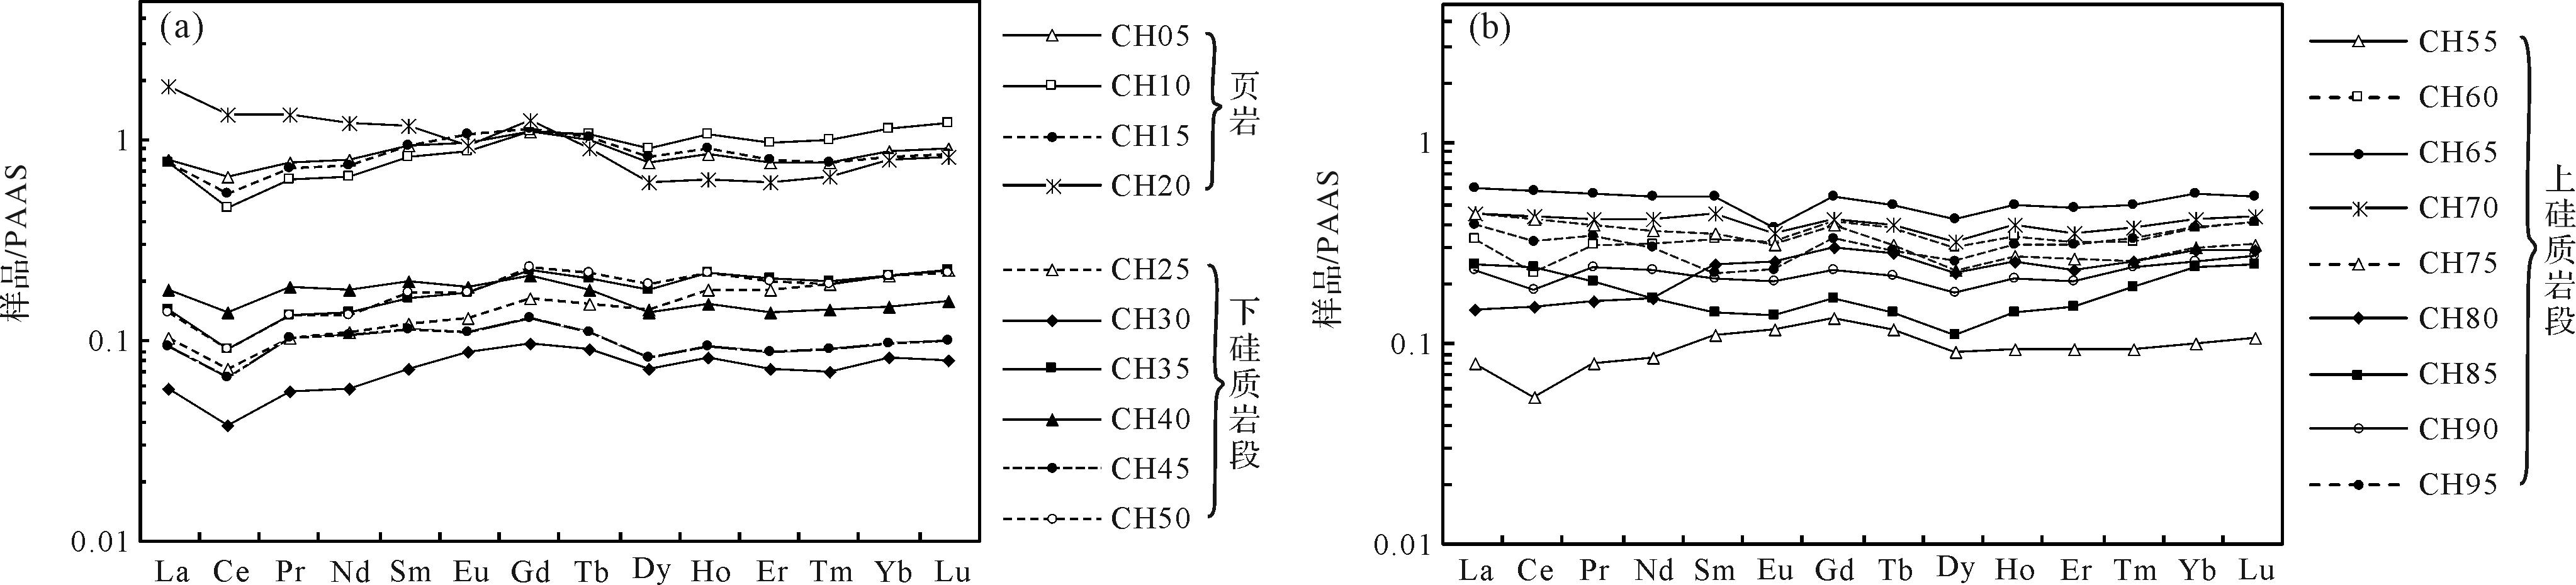
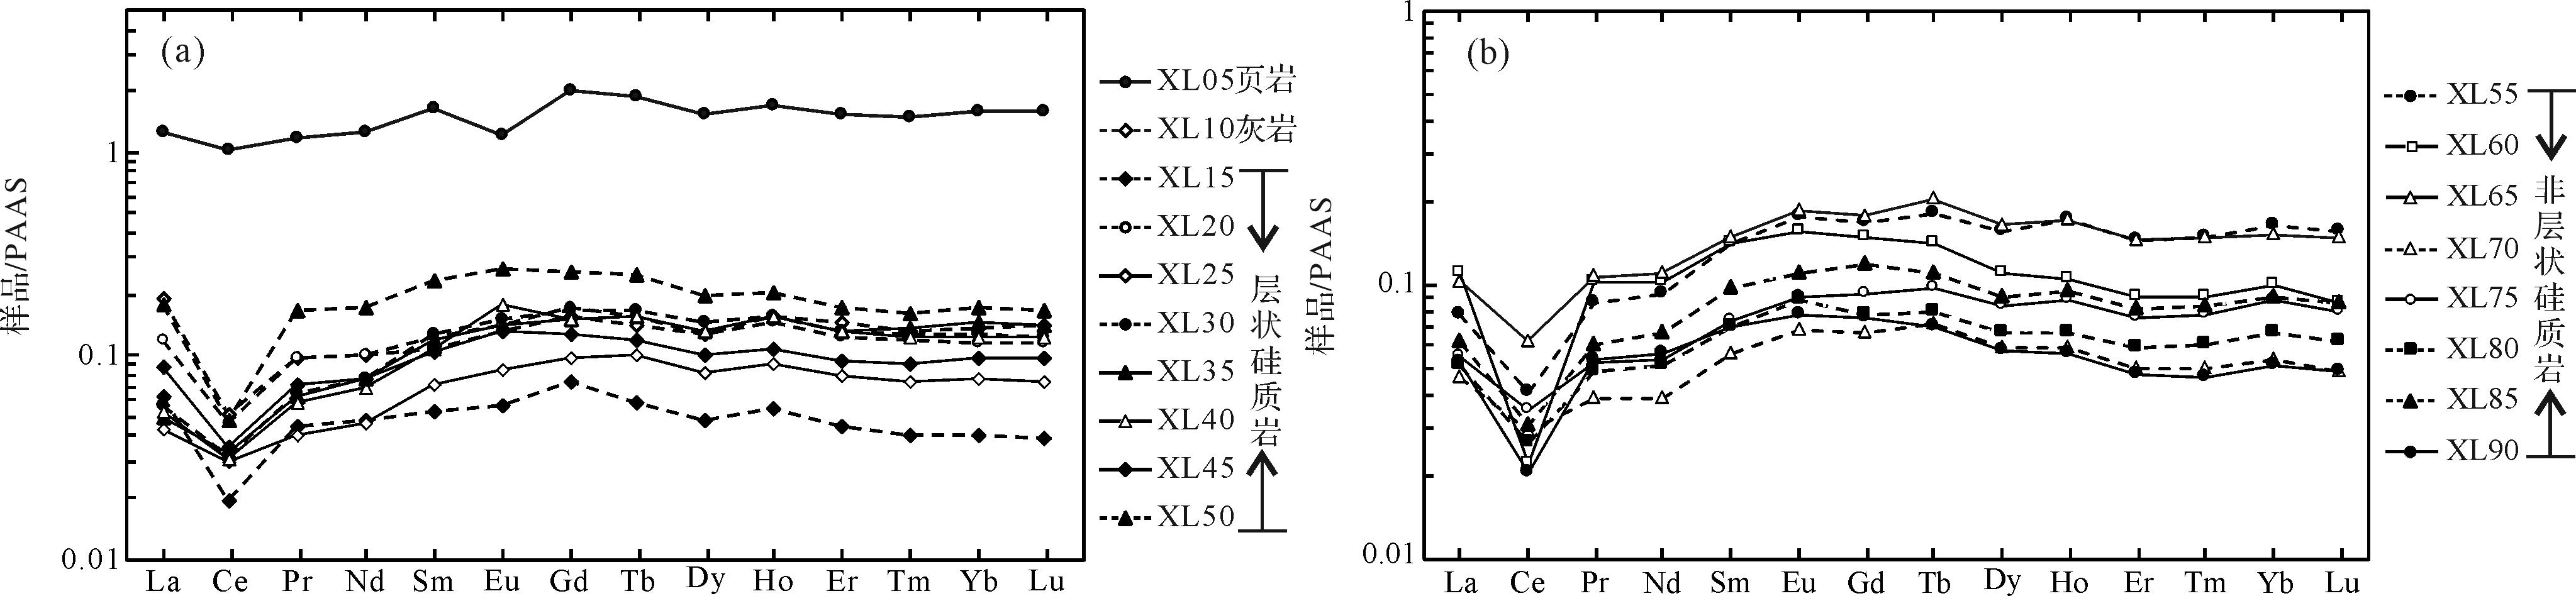
稀土元素Eu的异常同样可以指示硅质岩的热液活动特征。由于稀土元素在海水中一般为III价态的离子形式存在,而Eu除了Eu3+,还存在一个Eu2+离子。这种特殊价态的存在,致使Eu常常出现异常的特征值。在岩浆活动过程中,Eu3+常常被还原为Eu2+,后者的离子半径更大,与周围的稀土元素半径相比均较大,进而出现分馏特征[30]。Eu的还原现象常出现在洋中脊的热液系统中[31]。在强烈还原环境中,Eu3+还原为Eu2+,其离子半径与Ba2+离子半径类似,经常被重晶石吸附而沉淀下来[30]。在热液系统中,Eu常常产生分馏而形成Eu的正异常[31],这是因为结晶化学的亲缘性致使还原形成的Eu2+通常被长石或其他矿物结合而形成Eu的分馏[32],造成Eu的富集。洋中脊热液流体的上覆海水中Eu的正异常最为明显,其Eu/Eu*比值可高达10[33],洋中脊附近的硅质岩中Eu/Eu*比值随着远离洋中脊由1.35逐渐下降至1.02[34]。远离热液喷口25 km(或100 km)以后,指示热液活动的Eu正异常信号基本不再被保存下来,虽然热液对区域性的海水影响仍然存在[34]。巢湖剖面孤峰组硅质岩的Eu/Eu*值大部分小于1.0(表3),仅在孤峰组下部的下硅质岩段中出现少量样品的Eu/Eu*接近1.0(图4,5),同样说明巢湖地区孤峰组硅质岩为非热液成因,但下部硅质岩段可能受到热液作用微弱的影响,由于远离热液喷口,其Eu的正异常无法保存下来。小涝剖面的Eu/Eu*值大部分大于1.0,最高可达1.4(表6),且孤峰组上部的非层状硅质岩段比下部的层状硅质岩段Eu正异常更为明显(图4,6)。说明小涝剖面距离热液喷口极近,保存了热液系统中Eu的正异常信号,为典型的热液硅质岩沉积。

Figure 5. Post⁃Archean Australian Shale (PAAS⁃)normalized REE pattern of the Kuhfeng Formation chert in the Chaohu section

Figure 6. PAAS⁃normalized REE pattern of the Kuhfeng Formation chert in the Xiaolao section
在正常的海水中,由于重稀土比轻稀土具有更强的无机络合作用而表现为更稳定的流体化学行为[35⁃36],因此轻稀土比重稀土更容易从海水中被清除,从而在海水的稀土元素配分模式图中显示轻稀土亏损的特征[30]。洋盆的热液流体具有轻稀土富集的特征[33],洋中脊热液将海水中大量的轻稀土吸收导致其周围海水具有轻稀土亏损的特征。因此,在洋中脊的硅质岩中,由于硅质岩主要吸附海水或者被热液改造过的海水的稀土元素,硅质岩稀土元素配分模式显示明显的轻稀土亏损特征,此时LuN/LaN比值高达3[37⁃38]。随着远离洋中脊,沉积物中LuN/LaN比值由1.55逐渐下降至0.87,至正常的洋盆则下降为0.37[34]。而在开放的大陆边缘海环境中,轻稀土被带出海水而显示出轻稀土亏损的特征,此时沉积物中LuN/LaN比值又升高至1.10左右[34]。巢湖剖面孤峰组硅质岩中LuN/LaN比值主要分布在1.2左右,仅在下部硅质岩段中出现部分高LuN/LaN比值的样品(表3),同时稀土元素配分曲线同样表明没有存在明显的轻稀土亏损的特征(图4,5)。然而,小涝剖面的孤峰组硅质岩中LuN/LaN比值普遍较高,最高接近3.0,平均值达2.3(表6),存在明显的轻稀土亏损特征(图4,6),这也说明小涝剖面孤峰组硅质岩很可能为热液成因。
-
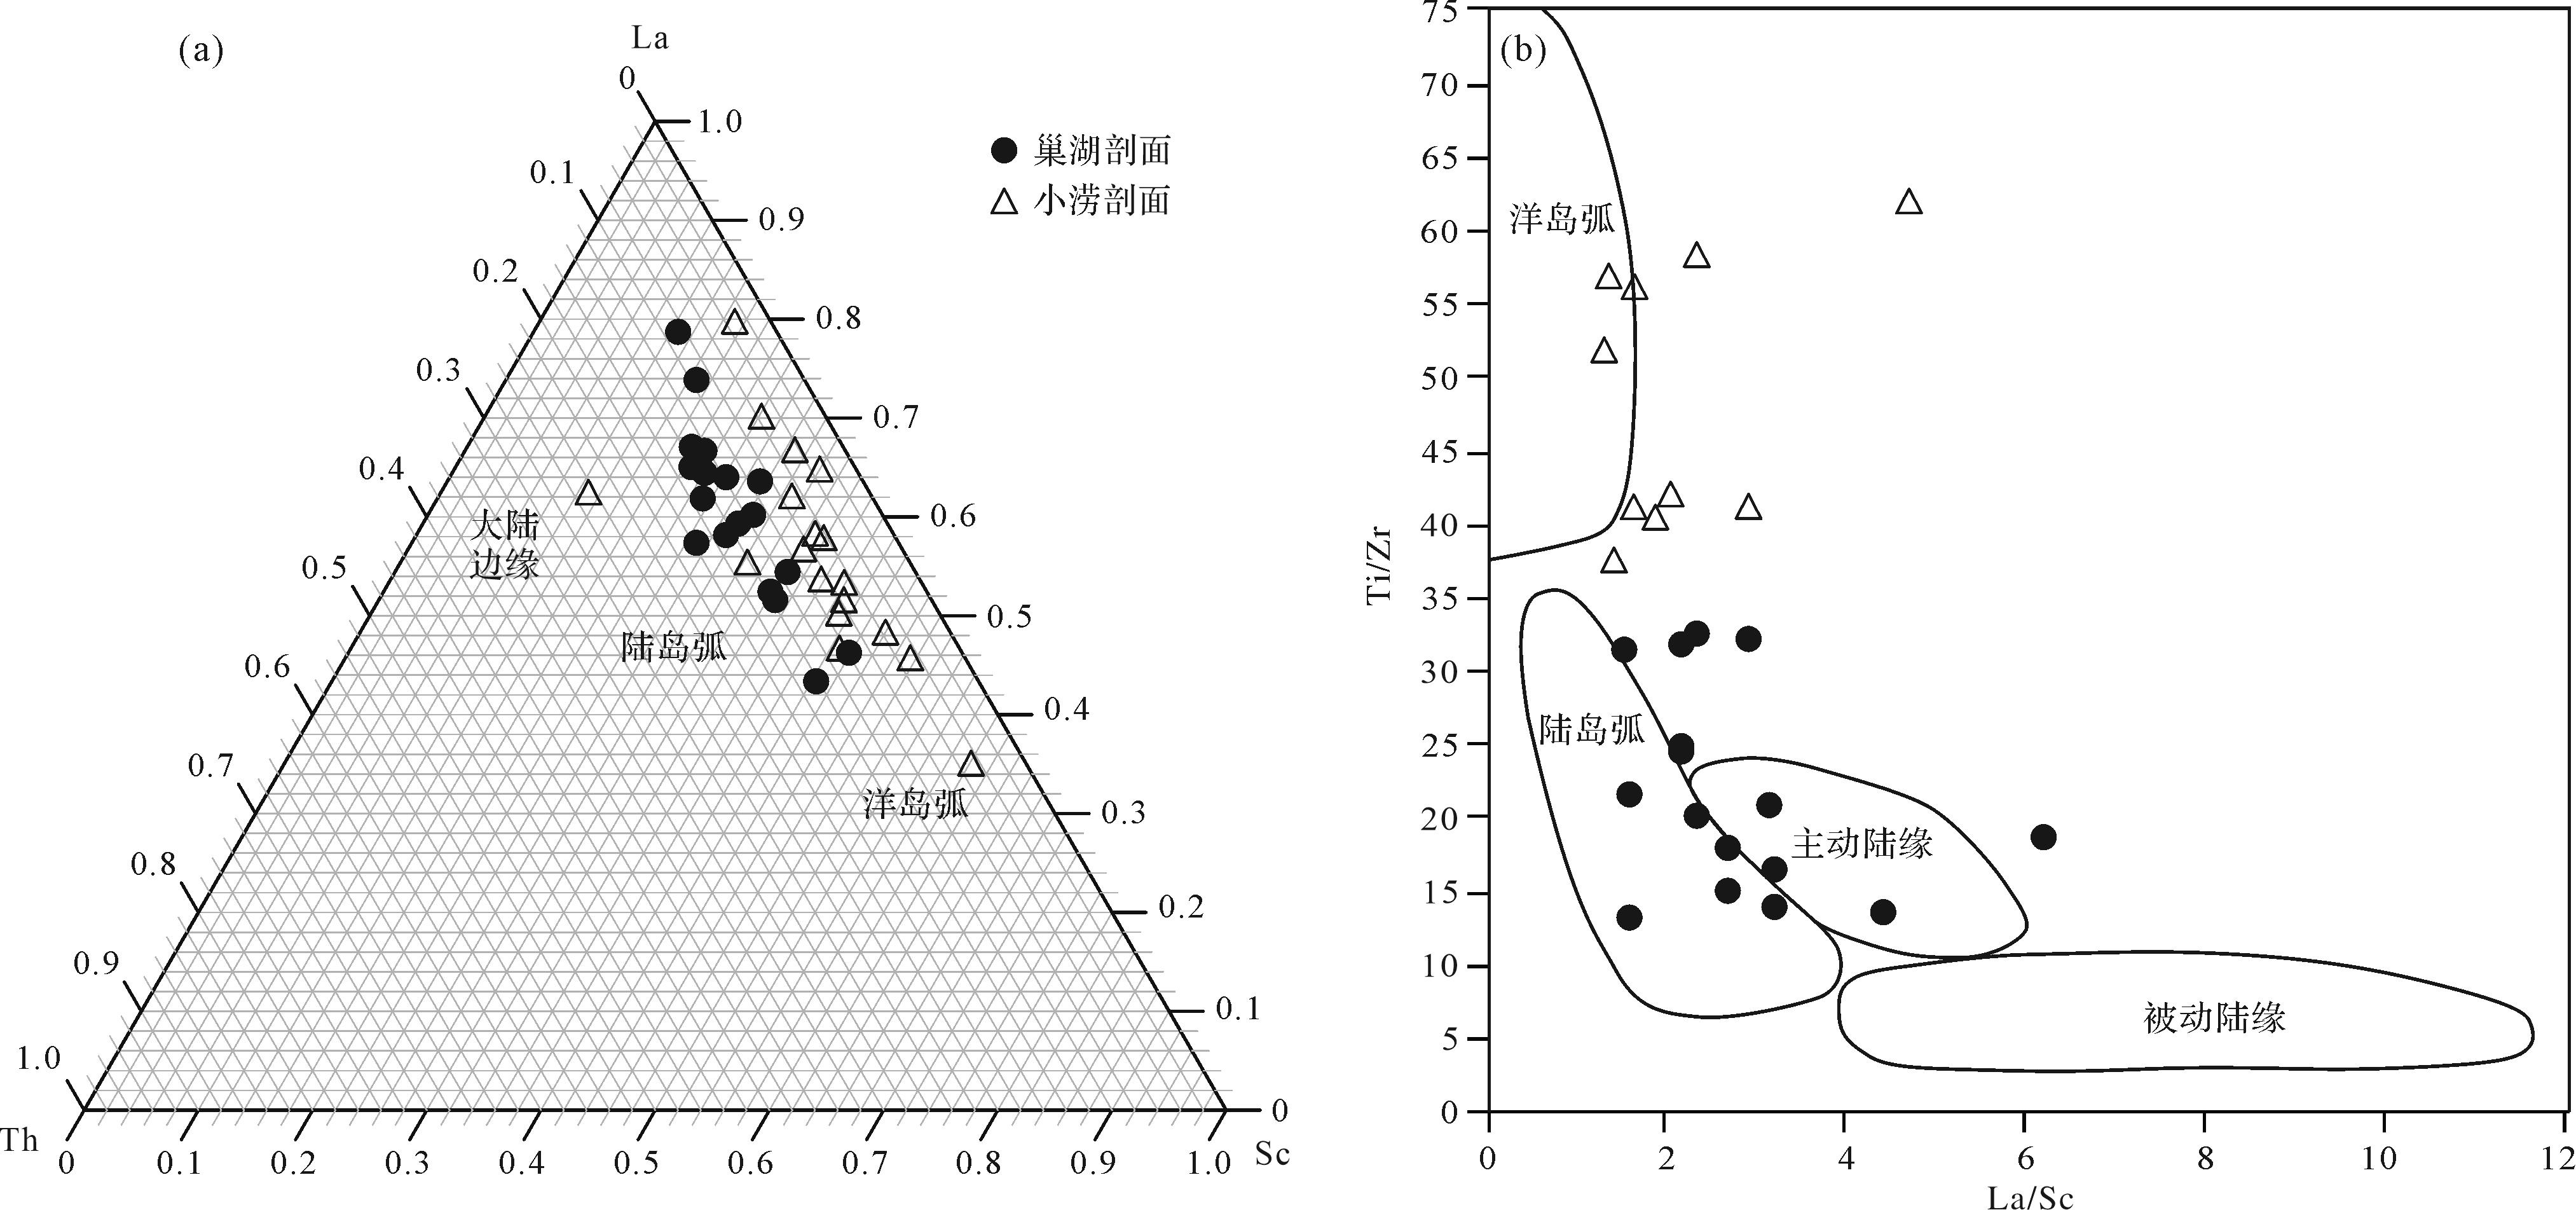
上述热液硅质岩的形成可能与下扬子区特定的构造背景有关。某些惰性微量元素能指示物源构造背景,例如元素La、Zr、Ce、Nd、Y、Hf、Nb、Ti、Sc、Th由于在沉积过程中迁移度较低以及海水居留时间较短,可以用于约束物源和构造背景[39]。在风化和搬运过程中,这些元素被定量地搬运到碎屑沉积岩中,因而能指示母源的信号[40]。La-Th-Sc三角图能区分不同的构造背景。洋岛弧样品往往展示较高的Sc含量以及较低的La/Sc比值(平均值为0.55±0.2),大陆边缘样品往往展示较高的La含量以及较高的La/Sc比值(La/Sc=4),而陆岛弧样品则处于上述两种环境的中间,表现为中等的La/Sc比值(平均值为0.8±0.3)[41]。该图能区分古生代洋和陆岛弧环境,但难于区分主动大陆边缘和被动大陆边缘。La/Sc与Ti/Zr的交会图则可以区分大陆边缘的构造背景。洋岛弧样品以Ti/Zr比值大于40以及La/Sc比值大于1为特征;陆岛弧样品一般以Ti/Zr比值为10~35以及La/Sc比值为1~3为特征;主动大陆边缘样品以较高的La/Sc比值(3~6)与陆岛弧样品相区分;被动大陆边缘样品以Ti/Zr比值小于10以及较高的La/Sc比值(3~9)与其他构造背景的样品相区分[41]。巢湖剖面和小涝剖面孤峰组硅质岩均不属于被动大陆边缘构造属性,前者反映陆岛弧和主动大陆边缘的构造属性(图7a),而后者反映洋岛弧构造背景(图7b)。主动大陆边缘和洋岛弧构造环境中热液活动较为常见,这从构造上解释了铜陵小涝孤峰组热液硅质岩存在的成因,以及巢湖地区孤峰组硅质岩部分样品保留微弱的热液活动信号的原因。

Figure 7. Indicative tectonic setting maps of Kuhfeng Formation chert in the chaohu and Xiaolao sections, Anhui province (base map is from reference [41])
-
上述分析表明,铜陵地区孤峰组青灰色层状和非层状硅质岩均为明显的热液成因。层状硅质岩内部发育结核状石灰岩,后者内部含薄板状硅质岩(图2e),表明硅质岩为原生沉积作用形成,而不是交代成因。局部发育的角砾状硅质岩的砾石成分为含石英脉的硅质岩(图2i,j),反映砾岩形成时其砾石为半固结的硅质岩,同样指示了硅质岩的原生沉积成因。非层状硅质岩内部含有大量的钙质生物如绿藻的裸海松藻属、钙扇藻属以及钙质海绵骨针等(图2l~o),表明热液硅质岩沉积时期混有较多的钙质骨骼生物化石。硅质岩中的二氧化硅成分最低为96 wt.%(表4),说明这些骨骼在成岩过程中全部被交代形成了硅质,其镜下正交偏光特征均为微晶石英结构也支持了这一点(图2)。青灰色—灰色非层状硅质岩内部含深灰色硅质结核,反映了沉积时期热液硅质与钙质混积在成岩过程中交代钙质的同时,在局部富有机质内部形成了自生的硅质结核。同时,在热液硅质岩内部富含绿藻、钙质海绵骨针等底栖钙质生物化石,说明铜陵地区附近的热液活动并没有对海水化学产生显著的影响,底栖生物的活动没有受到较大的威胁,热液活动带来的还原性物质可能无法改变海水的氧化还原条件。从这一点上看,热液活动地质事件难以通过形成缺氧环境的方式引发有机质的富集。
巢湖平顶山地区距离铜陵叶山小涝地区直线距离约80 km,远离热液喷口,其黑色薄层硅质岩的沉积虽然很难保存热液活动的信号,但很可能受到热液带来的硅的影响。巢湖平顶山孤峰组硅质岩中Eu异常以及Al/(Al+Fe+Mn)中微弱的热液信号也证实了这一点。说明位于江南台地斜坡环境(如铜陵与池州一带)中的热液活动带来的大量硅质,可能是下扬子地区孤峰组沉积丰富的黑色薄层硅质岩的主要原因。但是,孤峰组黑色硅质岩中异常高的有机质富集[26]与热液活动是否有关?从构造上看,下扬子盆地周边斜坡环境中主动大陆边缘与洋岛弧性质的构造活动形成频繁的热液活动,为下扬子海带来大量的营养物质,构造裂陷形成的较深水下扬子盆地[10]是汇聚营养物质的优质古地理场所,从理论上讲热液可能是该区孤峰组富有机质的主要原因之一。但目前还没有相关的证据,而且热液活动频繁的小涝剖面有机碳含量并不高[18],这可能与其较浅水且水动力条件较强的上斜坡环境不利于有机质保存有关,有机质含量的高低不能真实地反映热液带来的营养水平。此外,巢湖地区营养物质的汇聚也可能来自周围古陆例如华夏古陆或苏北地区的古陆,以及洋流上涌[16]和多个火山灰层[2]指示的火山活动。
5.1. 硅质岩成因
5.2. 硅质岩的沉积构造背景
5.3. 下扬子孤峰组热液硅质岩的意义
-
安徽铜陵地区孤峰组青灰色硅质岩为热液成因,矿物呈微晶石英结构,是由热液带来的硅酸原生沉积而成,混有部分钙质生物化石沉积。铜陵地区距离热液喷口较近(小于25 km),其孤峰组硅质岩保存显著的热液地球化学信号。铜陵地区位于江南浅水台地与下扬子盆地之间的过渡带斜坡环境,因而下扬子地区中二叠世斜坡环境中可能存在频繁的热液活动。巢湖地区孤峰组黑色薄层硅质岩为典型的生物成因硅质岩,含丰富的硅质海绵骨针和放射虫,但部分层段硅质岩中仍然记录微弱的热液活动信号。表明巢湖地区的黑色薄层硅质岩虽然为生物成因,但其硅质的最终来源可能是附近的热液活动,只是由于与热液喷口存在一定的距离(如大于25 km),导致其热液信号的地球化学记录较为微弱。据此,下扬子地区中二叠统孤峰组普遍的黑色硅质岩的硅来源,可能与其盆地周围斜坡环境的热液活动有关。同时下扬子盆地周围频繁的热液活动可能给盆地带来了大量的营养物质,造成该区孤峰组异常的高有机质富集。

 DownLoad: